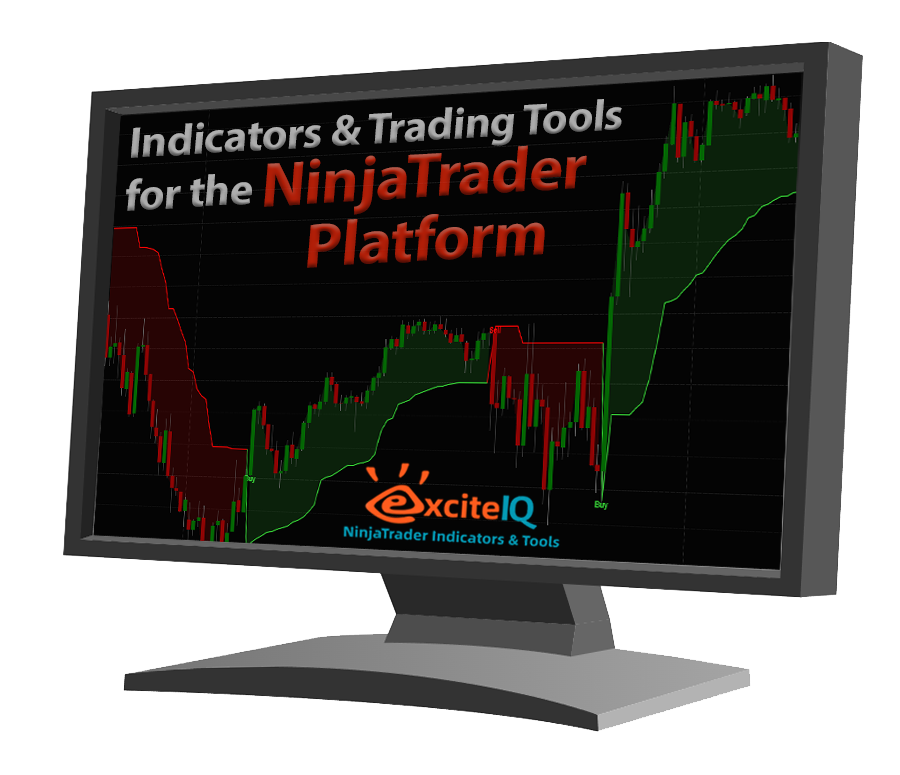
At ExciteIQ, we develop practical indicators and trading tools for the NinjaTrader 8 platform — ranging from essential utilities to advanced solutions, with a strong focus on performance and reliability.
Built from the experiences of active live trading, our tools are designed to enhance decision-making, improve workflow efficiency, and support clearer, faster analysis in live markets.
We continually refine our offerings based on real trading experience and user feedback. If you have suggestions for improvements or specific features you’d like to see, please contact us — we welcome input and may incorporate it into future updates. Custom development requests are also considered on a case-by-case basis.

“A very useful tool to help you very quickly size your trades correctly - leaving you to focus your mind on the price action”
Quickly and accurately calculate position size and manage risk directly on the chart.
Draw your entry and stop-loss levels — the tool instantly displays the correct number of contracts based on your chosen risk amount (e.g., $300 per trade). It automatically projects your reward targets and visualizes the full trade setup with exact exit levels and potential profit at each target.Key Features:
Set default risk amount, reward ratios, and account parameters once
Drag-and-drop entry, stop, and target lines with real-time contract sizing
One-click “Arm Trade” button to automatically submit bracket orders with correct size
Works on futures, forex, and stocks
Clean, non-cluttered display designed for live trading
Designed for traders who demand precision and speed without manual calculations.

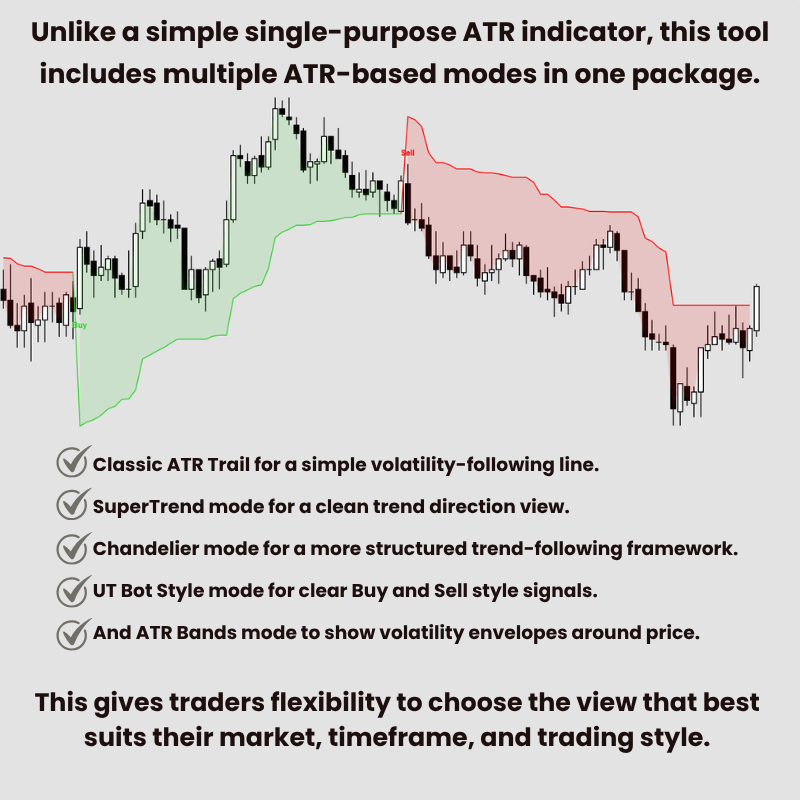
A powerful and enhanced Multi-Mode ATR Trading tool designed to help traders determine market direction and volatility structure with the use of trailing stops.
The ATR Volatility Trading Tool is a multi-mode indicator based around ATR, volatility, trend direction, and price distance from a dynamic volatility line or band.
It is designed as a discretionary trading aid helping you see market direction, volatility structure, possible trend changes, pullback areas, and volatility-based price bands. The indicator includes five main operating modes:
Classic ATR Trail
SuperTrend
Chandelier
UT Bot Style
ATR Bands
Each mode uses ATR in a slightly different way. You can choose the mode that best fits your trading style, timeframe, and the market conditions.
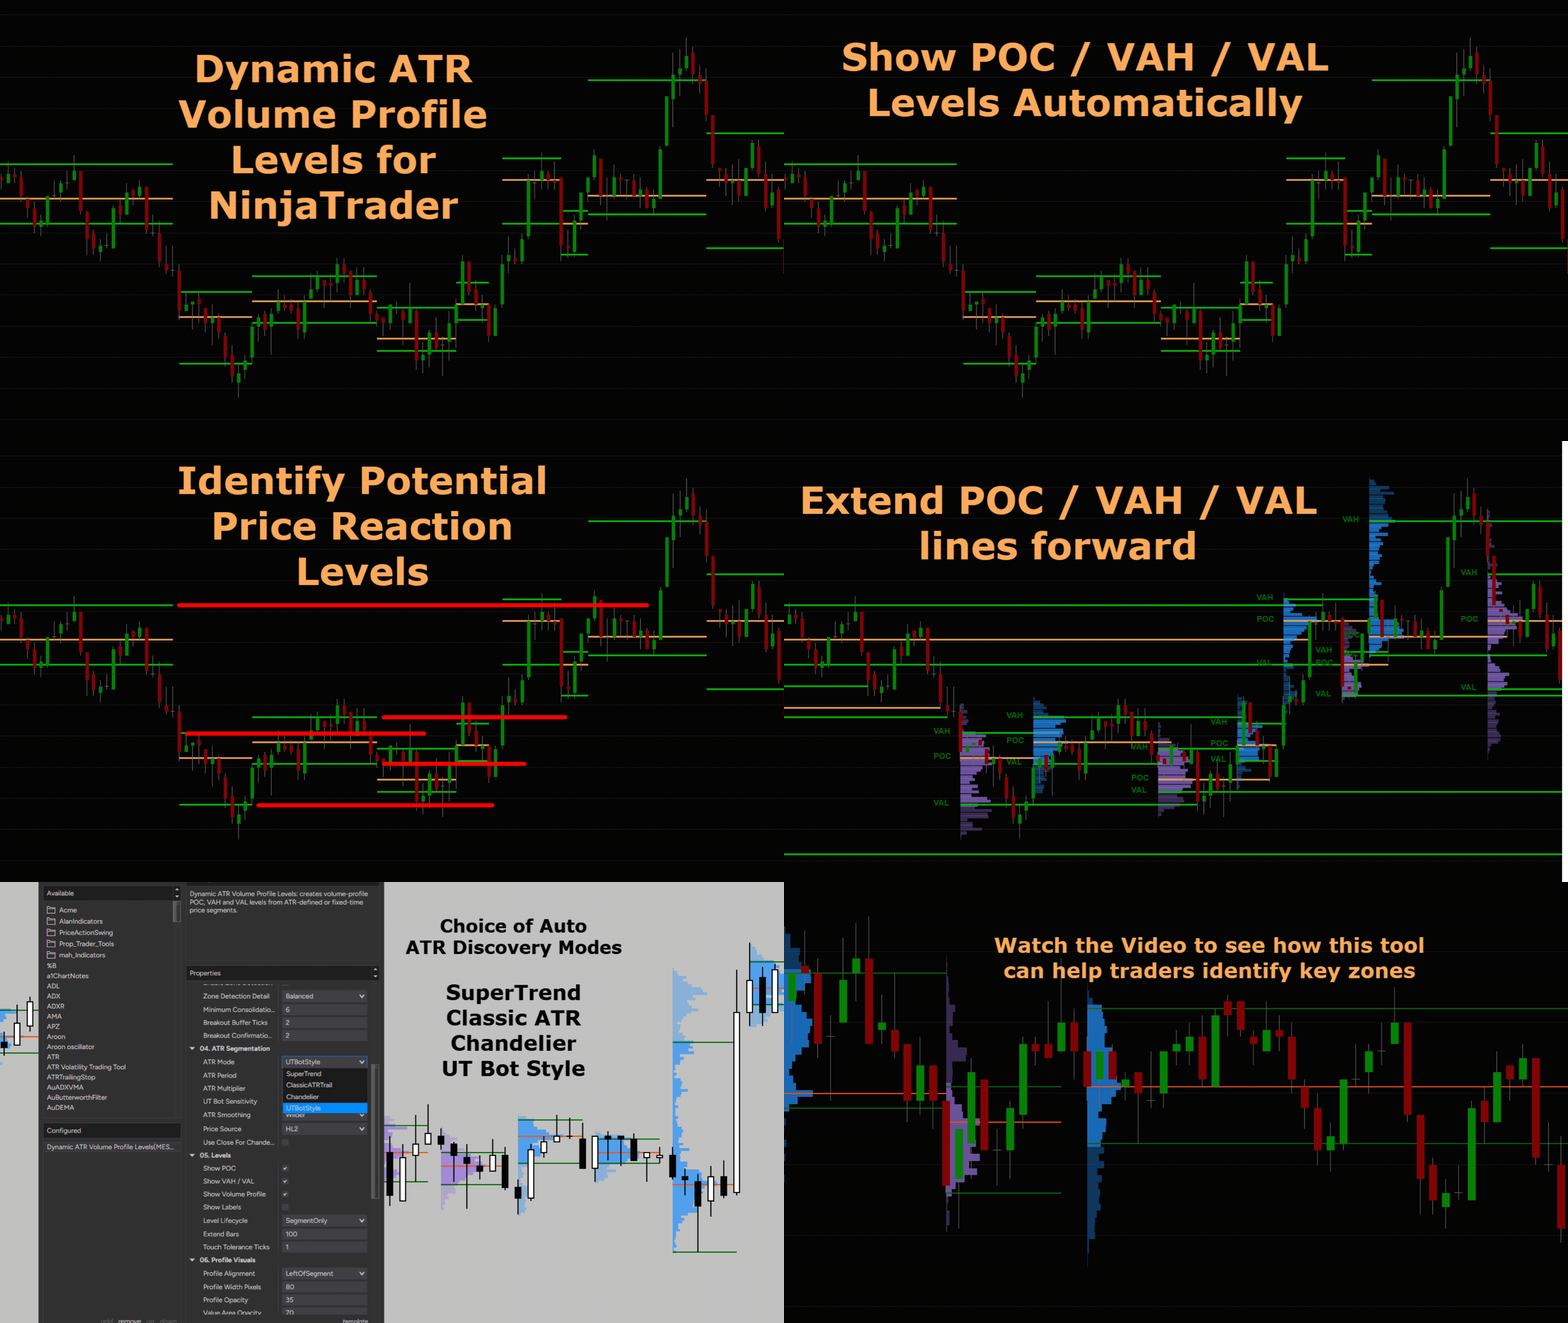
If you use volume profile concepts, this indicator gives you a fast and easy way to bring POC, VAH and VAL levels into your NinjaTrader charting.
Identify potential price reaction zones from POC, VAH and VAL levels - discovered automatically.
The Dynamic ATR Volume Profile Levels indicator is a tool designed to automatically identify important price areas and plot volume profile levels directly on your chart.
Instead of manually drawing volume profiles over every move, pullback, consolidation, or fixed time period, this indicator can automatically calculate and display key profile levels, including:
POC — Point of Control
VAH — Value Area High
VAL — Value Area Low
These levels can help traders identify potential reaction areas, support and resistance zones, breakout retest areas, and locations where price may pause, rotate, reject, or continue.
Click find out more and watch the video to see the indicator in action.
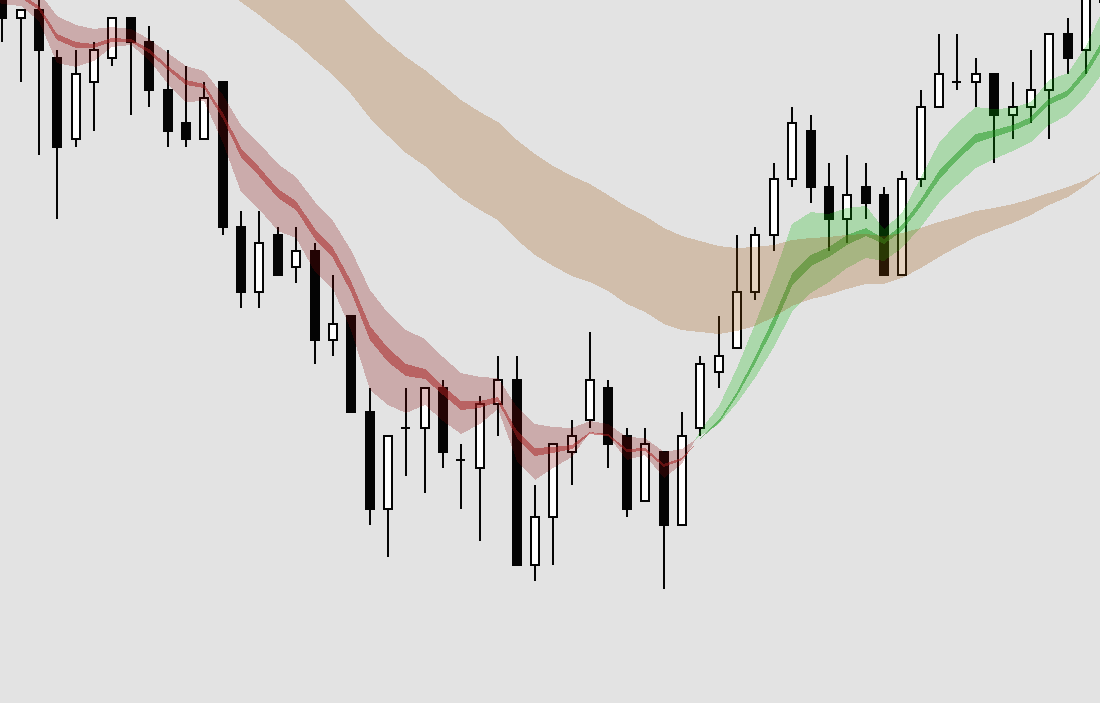
Add Cloud styling to your EMA’s - even set them up like the popular “Ripster EMA Clouds” Indicator.
Our Multl-coloured EMA indicator allows you to not only set different line colors and styles, but shading between up to 6 EMA’s too. This let’s you see clouds between ema bands. Find out more by clicking the button below.
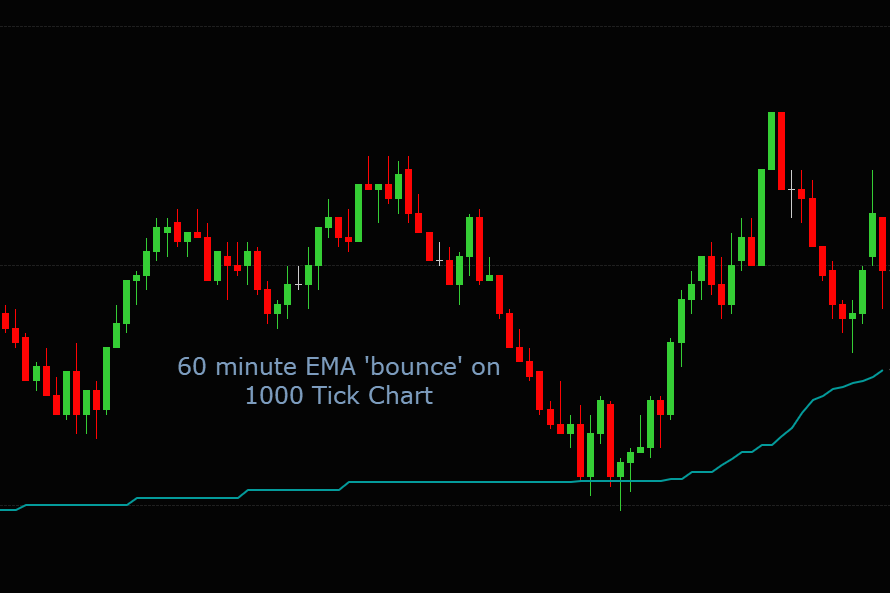
See minute based Moving Averages on Tick or Volume Charts
It’s useful to see where for example a 20 or 60 minute EMA is on a lower time frame tick chart. This helps you understand direction and possible locations where price might react off popular moving averages.
Looking for a World Class Trading Platform and Quality Data Provider?
We recommend NinjaTrader and Kinetick - especially for futures trading. Please click on the links below for more information.