Minute Based Averages for Tick, Volume & Range Charts
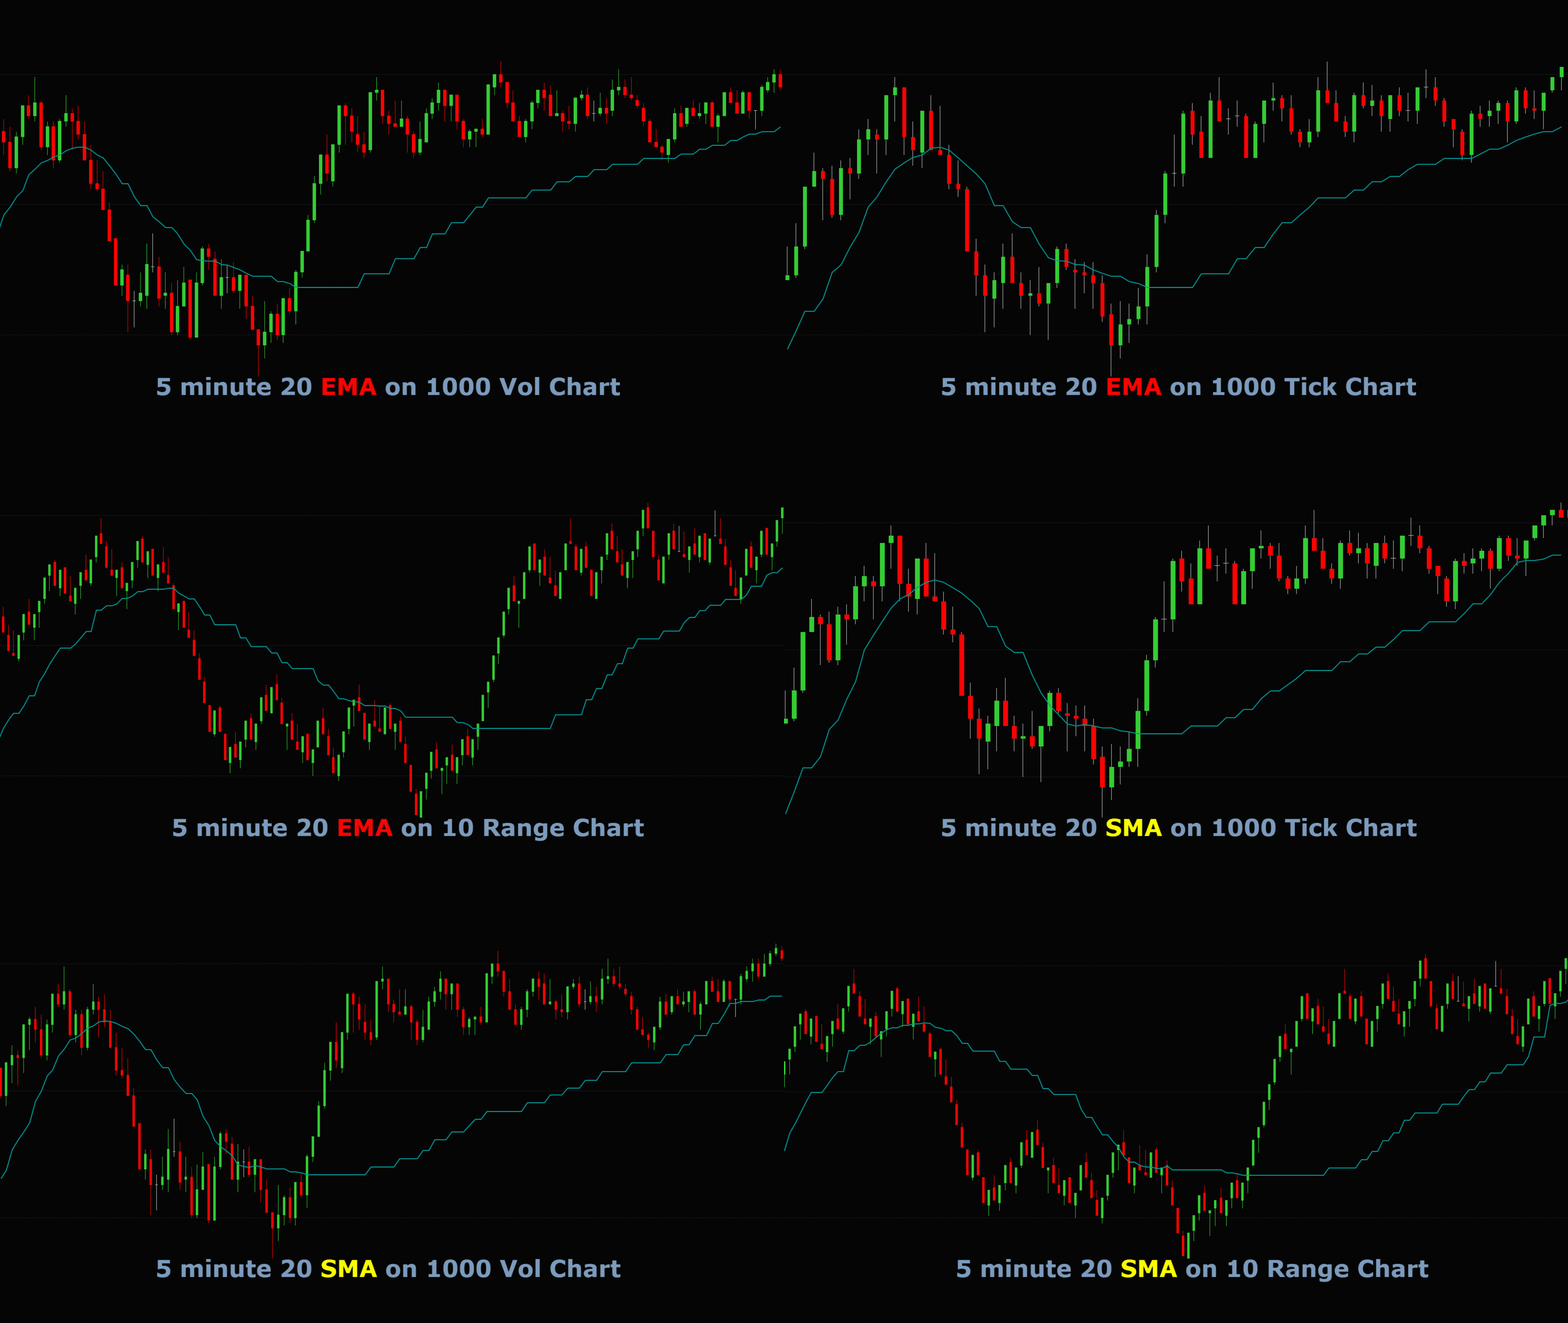
See your key Minute-Based moving averages on the charts you actually trade
Many traders use Tick, Volume, or Range charts for trade execution because they can offer a cleaner view of price movement, momentum, and short-term structure.
But there is one common problem.
The moving averages many traders watch — such as a 5 minute, 20 minute, or 60 minute EMA or SMA — are normally tied to minute charts. If you are trading from a 1000 tick chart, a volume chart, or a range chart, those important minute-based averages are not always visible where you need them most.
Minute Based Averages for Tick, Volume & Range Charts solves that problem.
This NinjaTrader indicator lets you plot a true minute-based EMA or SMA directly onto Tick, Volume, and Range bar charts.
For example, you can display:
A 20 EMA calculated from a 5 minute chart, plotted onto a 1000 tick chart
A 50 SMA calculated from a 15 minute chart, plotted onto a range chart
A 200 EMA calculated from a 60 minute chart, plotted onto a volume chart
This gives you the benefit of your preferred execution chart while still keeping important higher-timeframe moving average levels visible.
Why this can be useful
Minute-based moving averages are widely used by traders for market structure, trend direction, support and resistance, pullbacks, and trade filtering.
A 20 EMA on a 5 minute chart, for example, is often watched by intraday traders. Price may pull back to it, bounce from it, reject it, or use it as a trend guide during strong moves.
But if you prefer trading from a 1000 tick chart or a range chart, you may not want to keep switching back and forth between charts just to see where that 5 minute EMA currently sits.
This indicator brings that information directly onto your active chart.
You can continue trading from your chosen Tick, Volume, or Range chart, while still seeing the minute-based moving average that many traders may be watching on their time-based charts.

Example Use Cases
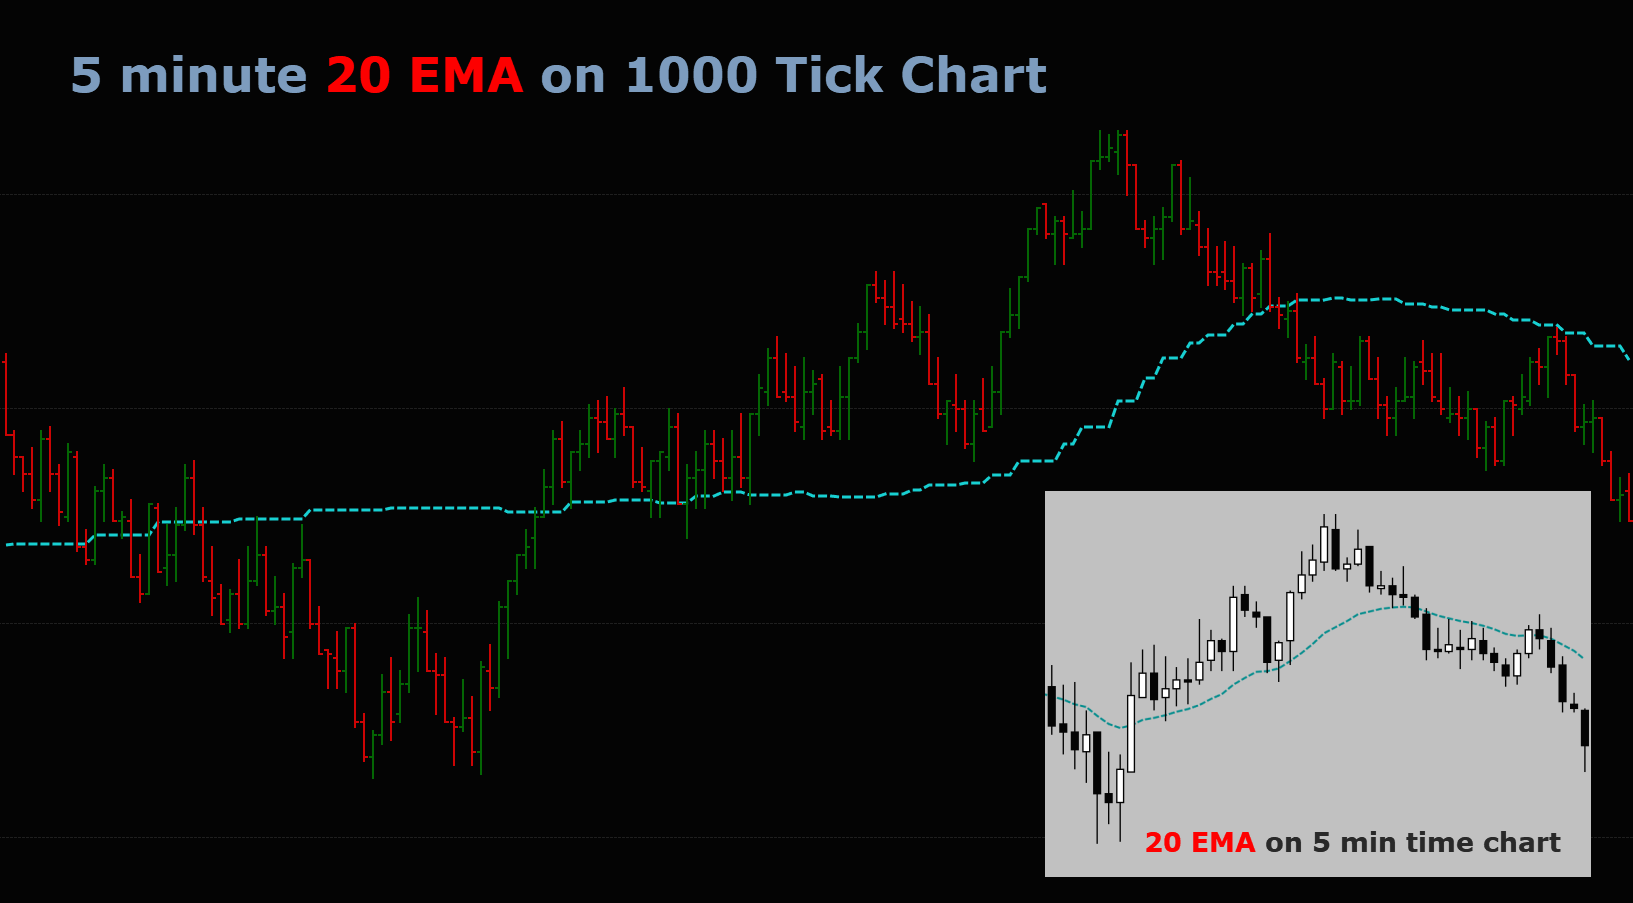
5 minute 20 EMA on a 1000 tick chart
A common use case is plotting a 5 minute 20 EMA onto a 1000 tick chart.
This can help you see when price is pulling back toward a widely watched intraday average, without leaving your tick chart. Some traders may use this as a visual guide for trend pullbacks, potential bounce areas, or whether price is holding above or below a key moving average.
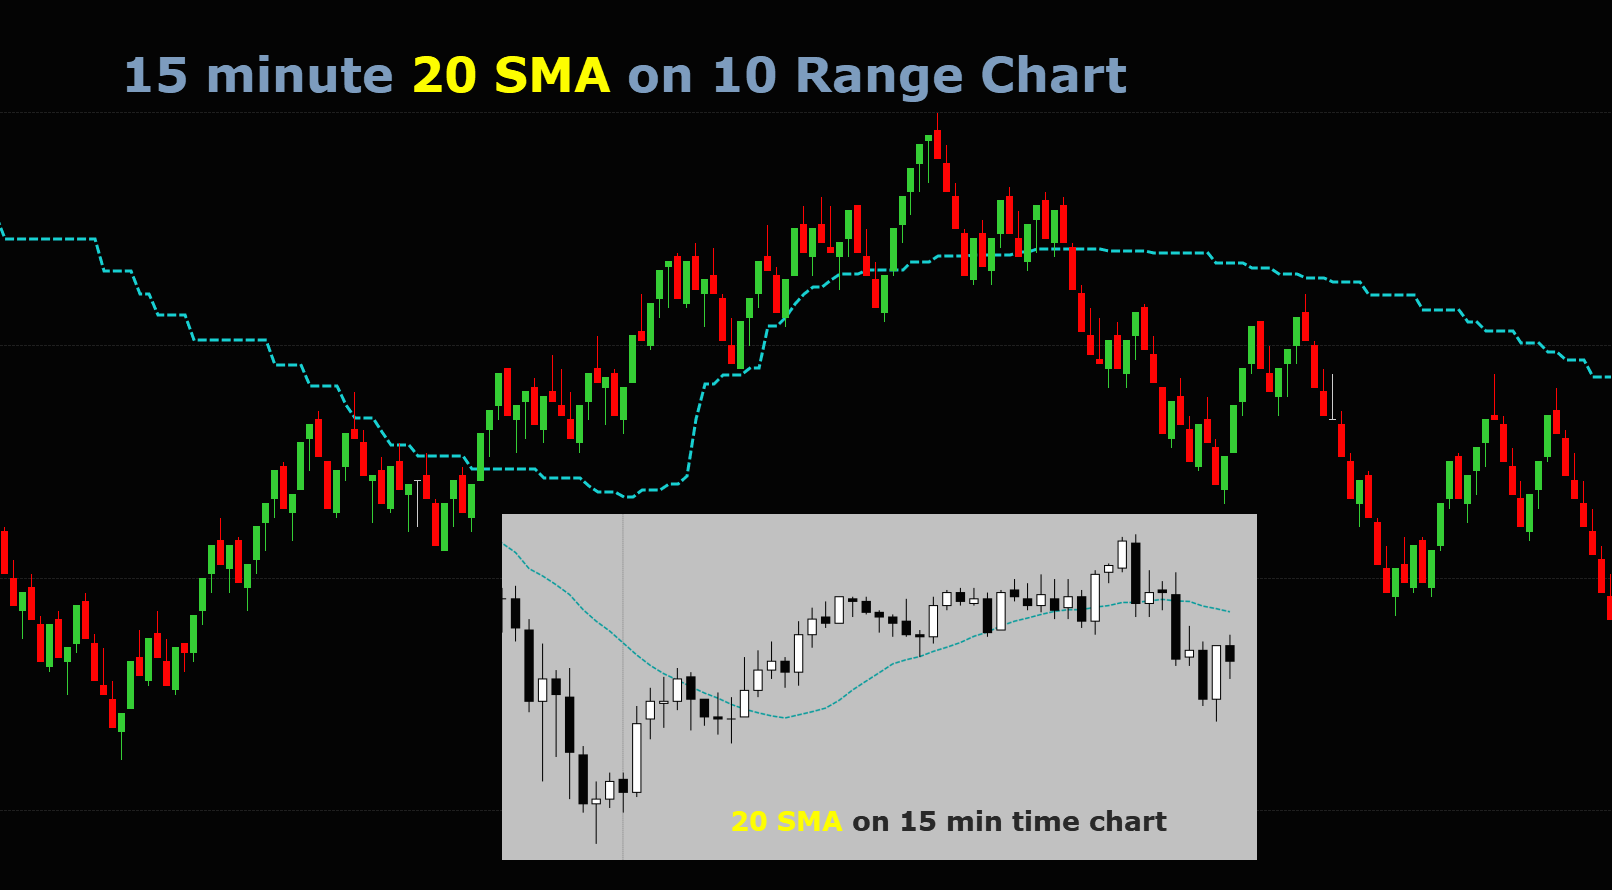
15 minute 20 SMA on a 10 range chart
Some traders prefer Range bars because each bar represents a fixed price movement rather than a fixed time period.
By plotting a 20 minute SMA onto a Range chart, you can add a broader market reference point while keeping the clean price structure of a Range chart.
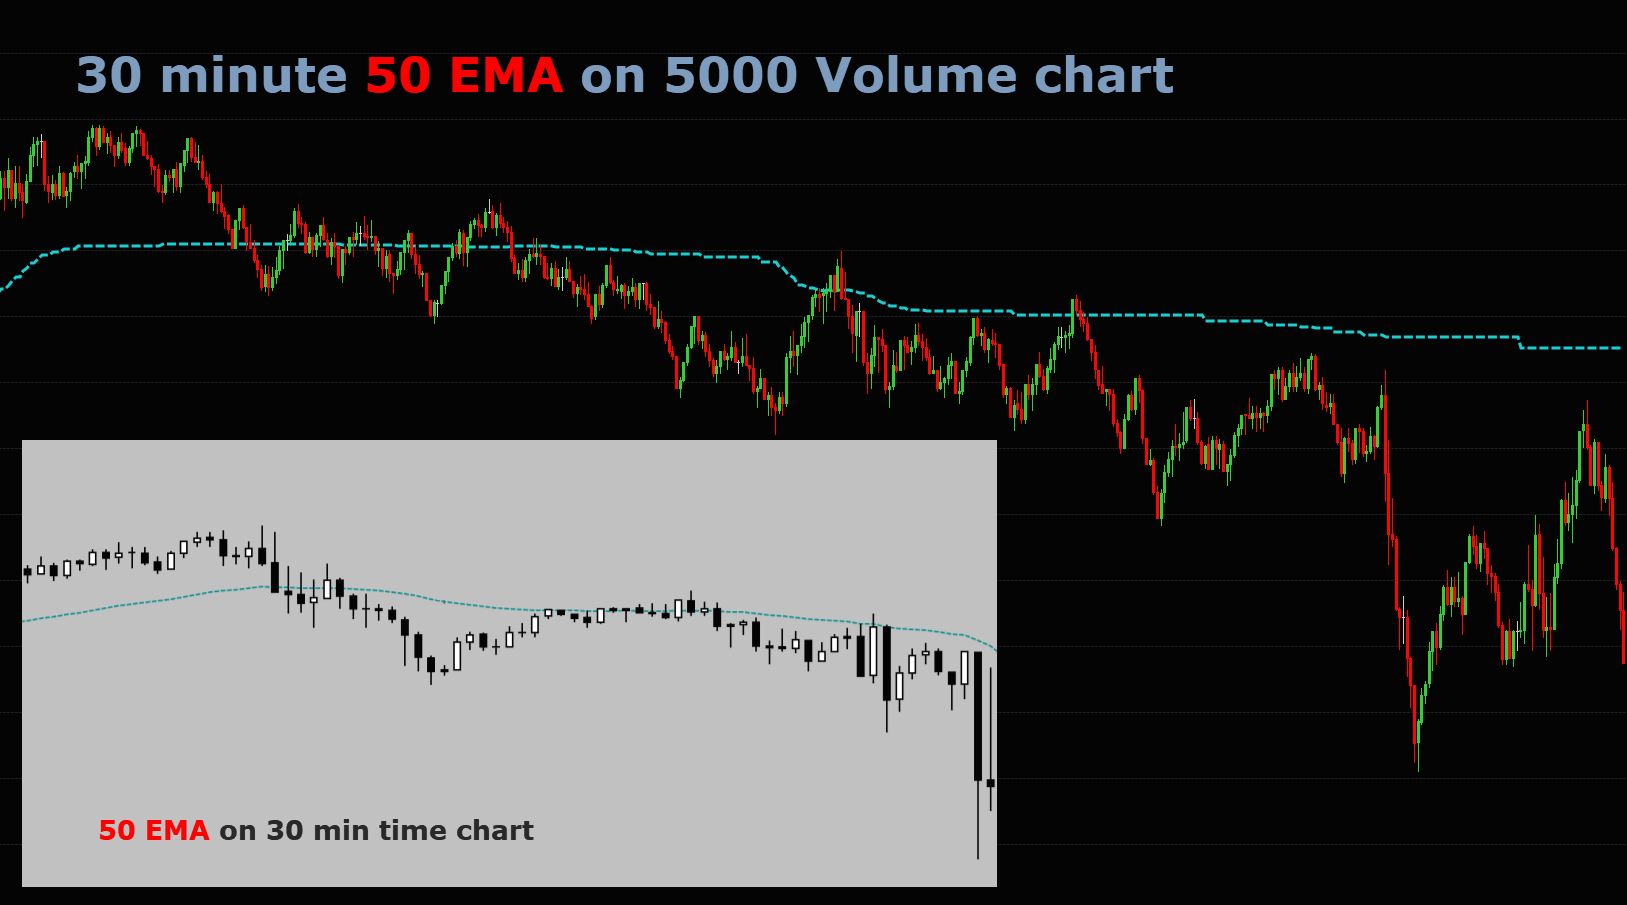
30 minute 50 EMA on a 5000 Volume chart
Volume charts can be useful for seeing price movement through actual trading activity rather than clock time.
Adding a 50 minute EMA to a volume chart can provide a higher-timeframe trend reference, helping you quickly judge whether price is trading above, below, or around a larger moving average.
EMA or SMA — your choice
The indicator supports both:
EMA — Exponential Moving Average
Useful when you want the moving average to react more quickly to recent price movement.
SMA — Simple Moving Average
Useful when you prefer a smoother, more traditional average of price over the selected period.
You choose the minute period and the moving average length.
For example:
5 minute 20 EMA
5 minute 50 EMA
15 minute 20 SMA
60 minute 200 EMA
Designed for Tick, Volume and Range charts
The indicator is designed specifically for non-time-based execution charts, including:
Tick charts
Volume charts
Range charts
It calculates the selected moving average from a minute-based data series, then plots that value onto your active chart.
This means the plotted line is not just an approximation based on the Tick, Volume, or Range bars. It is based on the selected minute period.
Main benefits
Plot minute-based EMAs or SMAs onto Tick, Volume, and Range charts
See key moving average levels without constantly switching charts
Useful for visualising pullbacks, bounces, rejections, and trend direction
Helps combine time-based market context with non-time-based execution charts
Simple settings and easy to apply
Useful for traders who already use EMAs or SMAs as part of their chart analysis
Keep your chart workflow cleaner

Without this type of indicator, traders often need to keep multiple charts open:
One tick chart for entries
One 5 minute chart for moving averages
One 15 minute chart for context
Possibly another higher-timeframe chart for trend
That can make the workspace crowded and slow down decision-making.
This tool helps reduce some of that visual clutter by bringing the minute-based average directly onto the chart where you are making decisions.
It does not replace good analysis or a trading plan, but it can make key moving average information easier to see.