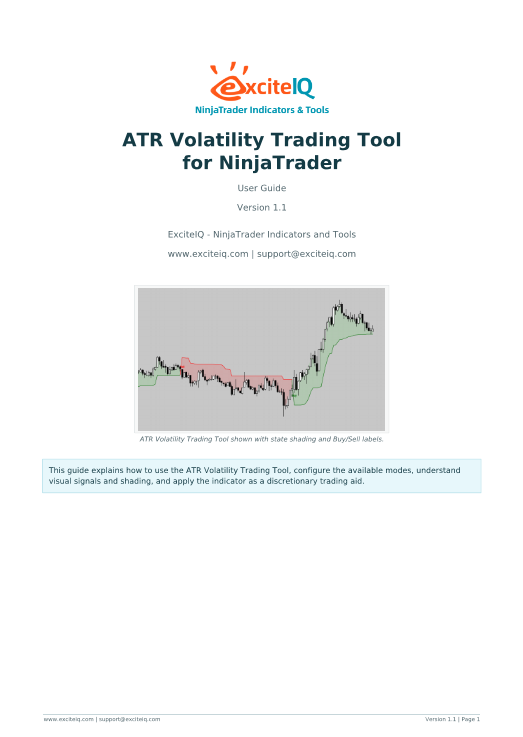
Multi-mode ATR Volatility Trading Tool
See Trend, Volatility, Pullbacks and Signals More Clearly
The ATR Volatility Trading Tool is a powerful multi-mode NinjaTrader indicator designed to help traders read price action through volatility.
Instead of relying on a single ATR line, this tool brings together several popular ATR-based approaches in one flexible indicator, including Classic ATR Trail, SuperTrend, Chandelier, UT Bot Style signals, and ATR Bands.
It is designed for discretionary traders who want a clearer visual framework for identifying trend state, possible reversals, pullbacks, volatility expansion, price distance from key ATR-based levels along with entry/exit signals and trailing stops.
Watch the video to see the indicator in action.

A Flexible & Powerful ATR Trading Tool
Many traders use ATR to help judge volatility, stop distance, and trend structure.
The problem is that most ATR indicators only do one thing.
The ATR Volatility Trading Tool is different.
It gives you multiple ATR-based views inside one NinjaTrader indicator, allowing you to switch between different modes depending on your market, timeframe, and trading style.
Use it as a trend filter.
Use it to highlight volatility zones.
Use it to show possible Buy/Sell state changes.
Use it to judge whether price is close to or extended away from the active ATR line.
The tool is a visual trading aid designed to help you make clearer and more confident trading decisions.
Designed to Help Traders See Clearly
The ATR Volatility Trading Tool is not just about signals.
It is about giving traders better visual context.
The indicator can help you see:
Whether price is currently in a bullish or bearish state.
Where the active ATR line is in relation to price.
When the tool detects a possible state change.
Whether price is pulling back toward the ATR line.
Whether price is extended away from the ATR line.
How far price is from the active line in ticks.
Whether volatility is expanding or contracting.
Whether the market is trending cleanly or flipping repeatedly.
This can help reduce hesitation, improve chart clarity, and support more disciplined decision-making.
Example Ways to Use the ATR Volatility Trading Tool
The information presented here is for educational purposes only, and is not to be taken as trading advice.
Pullback Trading
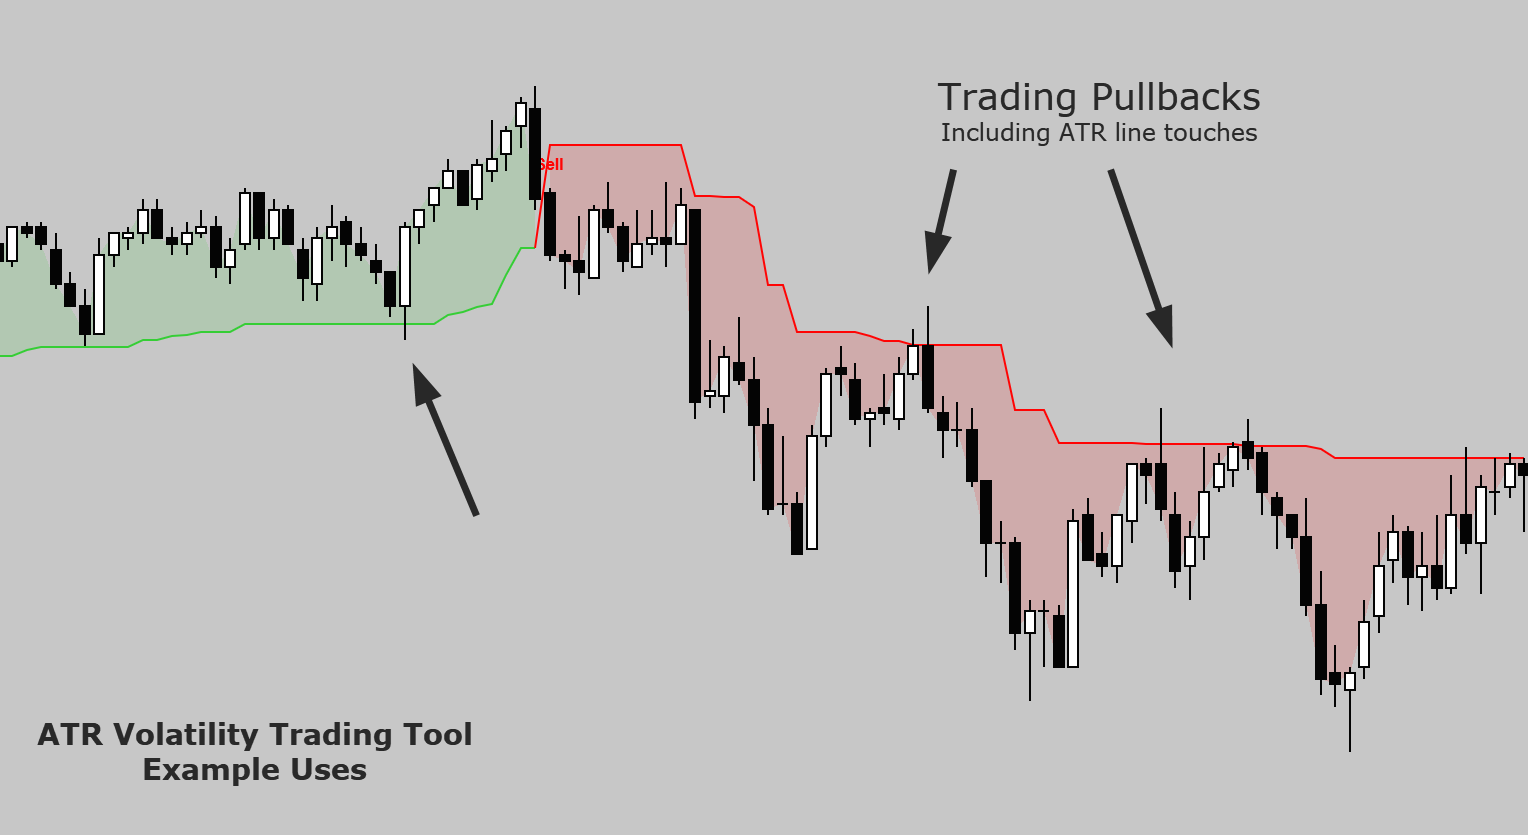
In a bullish state, price pulling back toward the ATR line can show a possible pullback area.
In a bearish state, price rallying back toward the ATR line can show a possible short-side pullback area.
The tool helps you see these areas clearly without manually estimating volatility.
Pullbacks which pierce the ATR line can be good possible setups to look out for.
Avoiding Late Entries
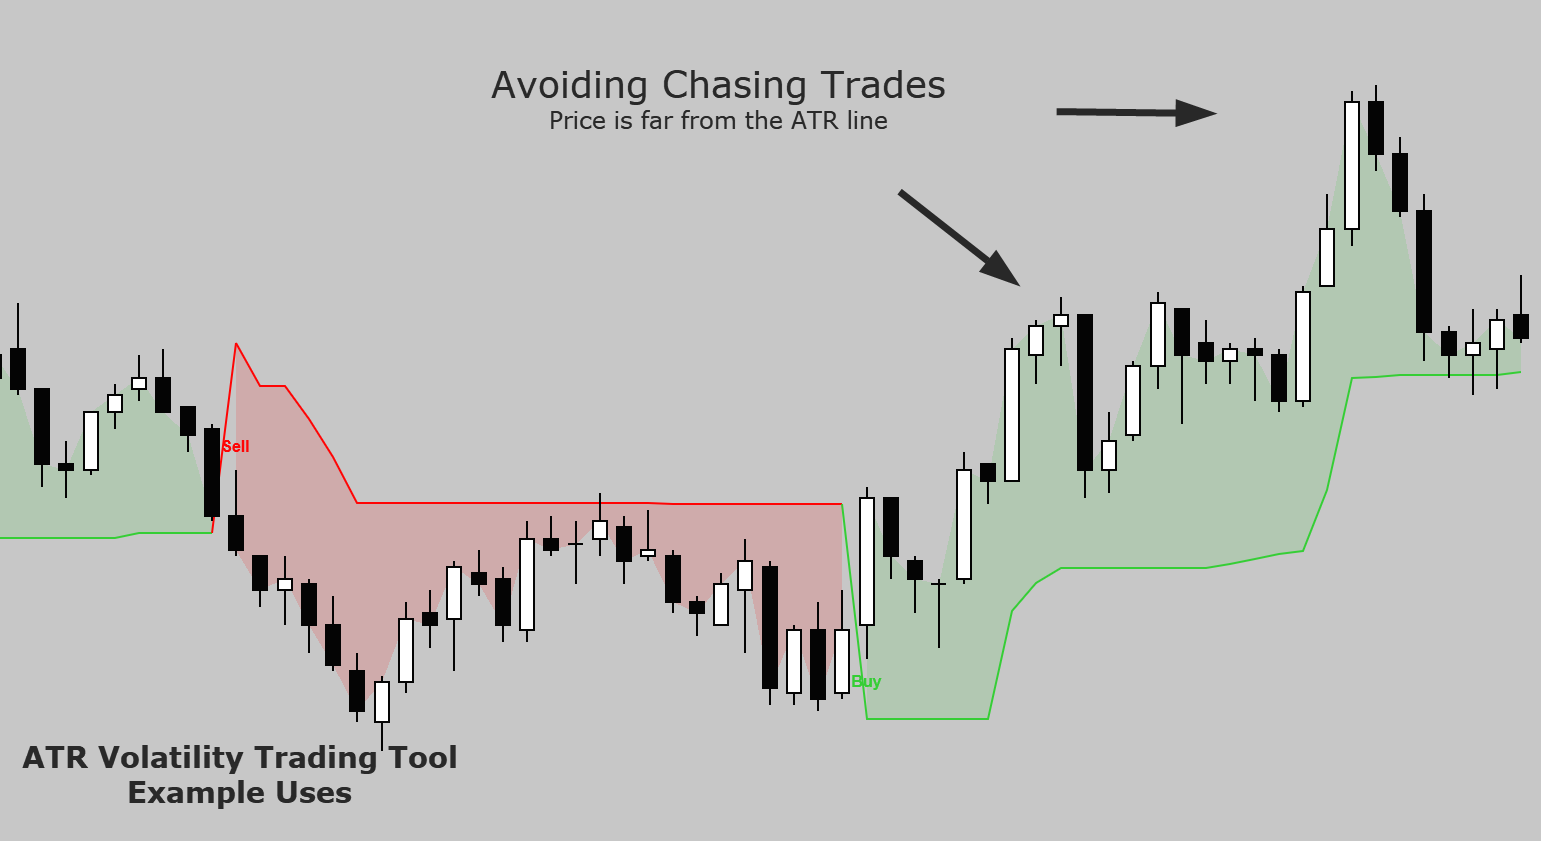
The distance display can help you avoid chasing trades when price is already extended away from the ATR line.
Visually seen, If price is far away from the active line, the move may already be stretched.
This can help traders be more selective and patient.
Spotting Choppy Conditions
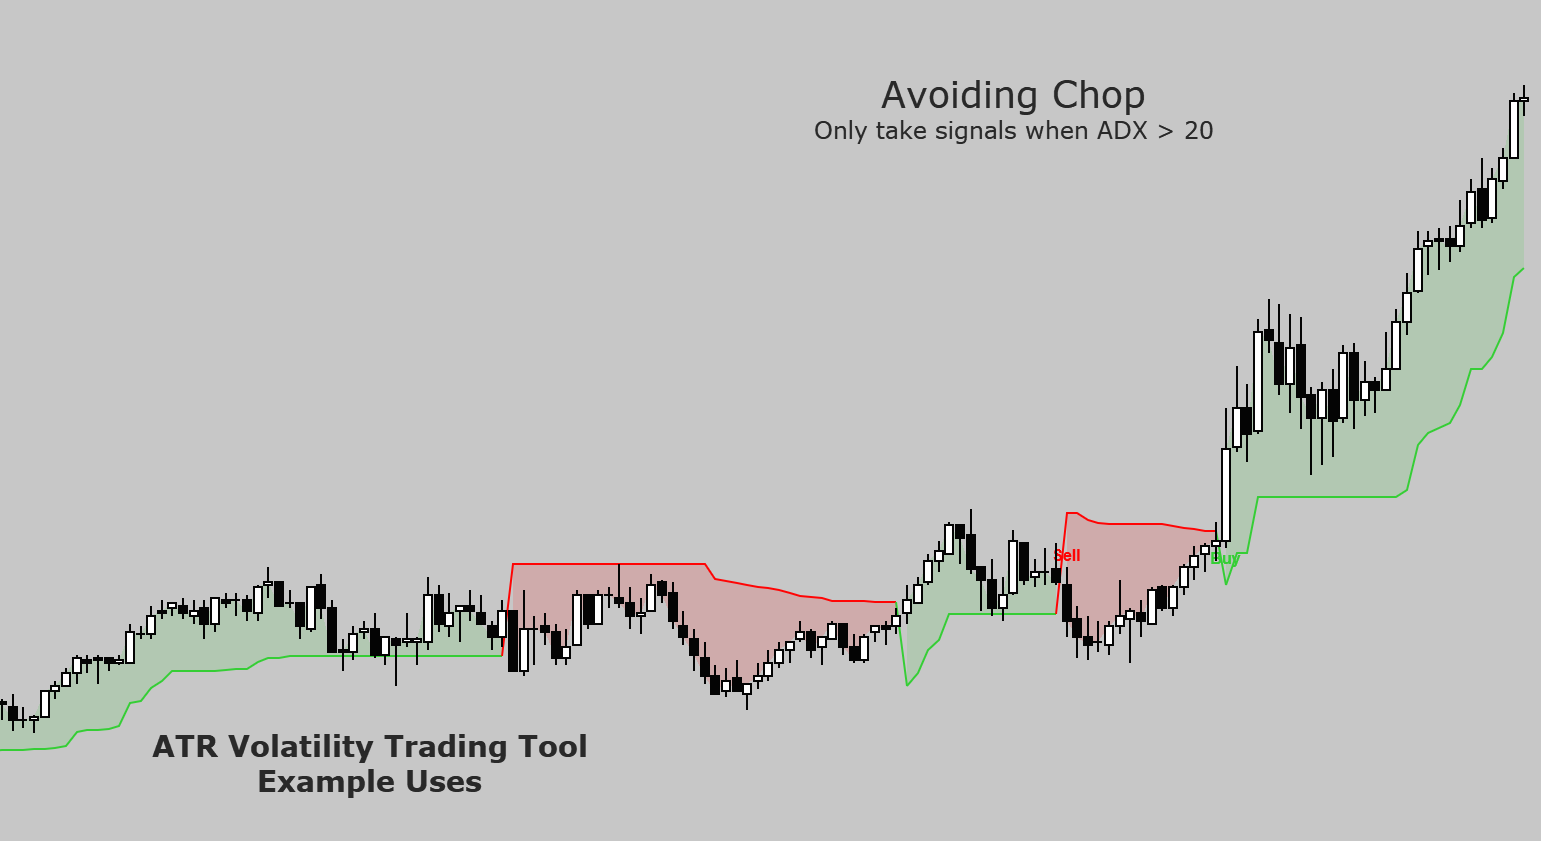
If the tool repeatedly flips from bullish to bearish and back again, the market may be in a range or choppy condition.
This can be a warning to reduce trade frequency, wait for clearer structure, or change to mean reversion trading - sell the highs, buy the lows.
For trend trading, enabling the ADX filter with a setting of 20-25 will help reduces signals in choppy conditions.
Lower Timeframe Scalping
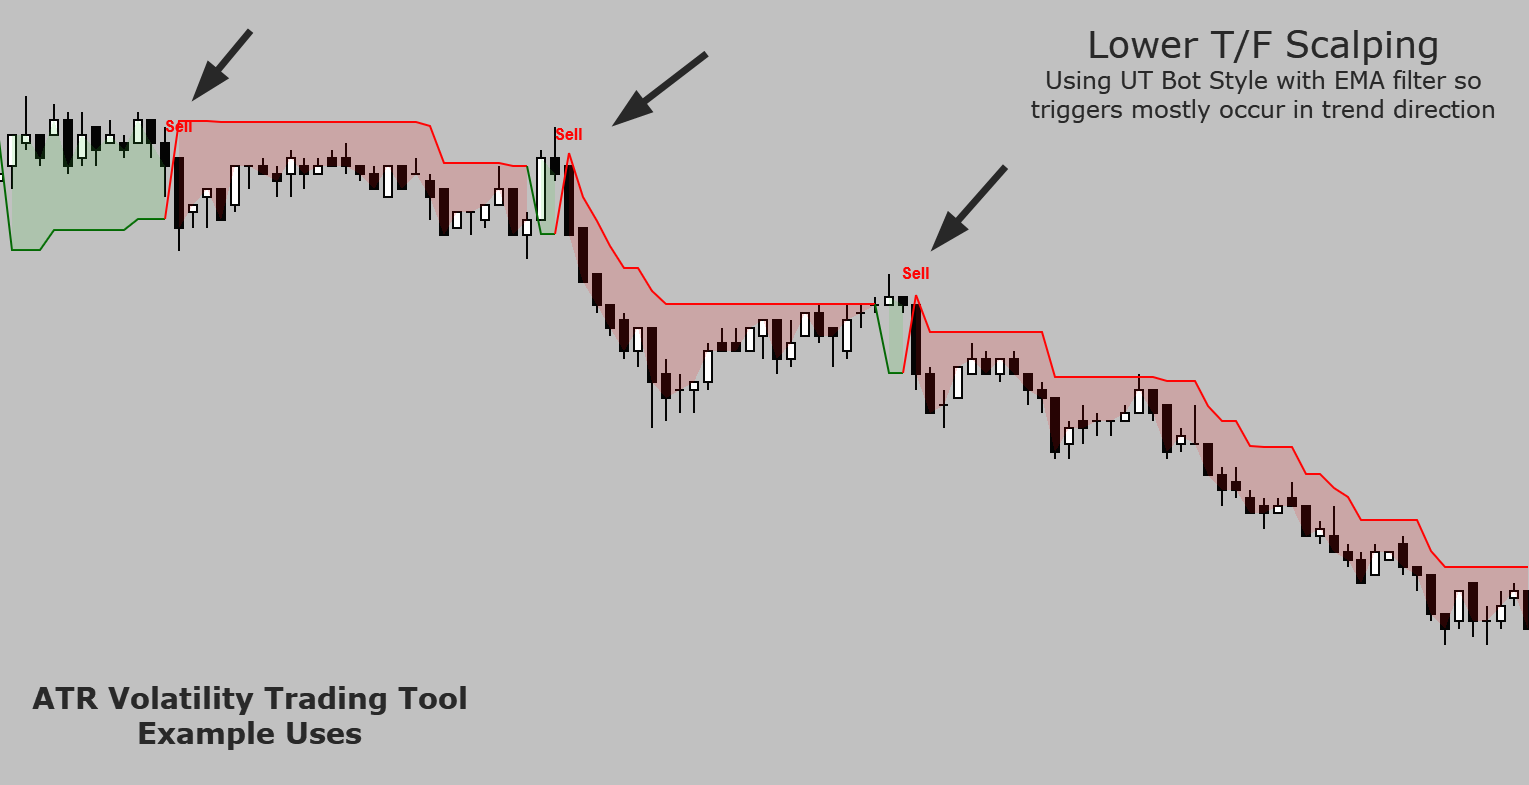
The UT Bot Style system could be very useful for scalping on a lower time frame such as the 1 minute chart.
Using a low “sensitivity” setting of say 2 for the UT Bot signals, in combination with an EMA filter of around 100, should mostly see signals in the main trend direction. There are other adjustments that can be made to filter out noise such as setting a minimum number of bars between signals.
Who Is This Indicator For?
The ATR Volatility Trading Tool is suitable for NinjaTrader users who want a clearer way to read price action using volatility.
It may be useful for:
Futures traders
Index traders
Forex traders
Intraday traders
Swing traders
Discretionary traders
Traders who like SuperTrend, Chandelier, or UT Bot style tools
Traders moving from TradingView-style visuals to NinjaTrader
Traders who want more chart clarity without automated execution
What You Receive
When you purchase the ATR Volatility Trading Tool, you receive:
NinjaTrader indicator file
Full user guide PDF
Installation instructions
Explanation of each mode
Explanation of all settings
Support from ExciteIQ
A few answers to questions about this indicator…
-
UT Bot style (or "UT Bot Alerts") refers to a popular ATR-based trailing stop system used in trading indicators and strategies, originally popularized by the "UT Bot Alerts" indicator on TradingView (created by QuantNomad and based on earlier ideas).
Core Idea
It uses the Average True Range (ATR) to create a dynamic, volatility-adjusted trailing stop line that adapts to current market conditions:
In an uptrend: The line trails below price by a multiple of ATR (e.g., ATR × "Key Value").
In a downtrend: The line trails above price.
When price crosses this trailing stop line, it signals a potential trend reversal → this generates buy/sell alerts and flips the trend direction.
This is more advanced than a basic fixed ATR trailing stop (like a simple Chandelier Exit) because it incorporates trend state logic and often pairs with other filters (e.g., EMA crossovers or Heikin Ashi candles) for cleaner signals.
How It Differs from Standard ATR Tools
Basic ATR Trailing Stop: Fixed multiplier, no built-in trend flip logic.
UT Bot Style: Adaptive + stateful (remembers current trend direction until price crosses the stop). It turns the ATR into a full signal-generating system rather than just a stop tool.
Often combined with Heikin Ashi for reduced noise or EMA for confirmation.
Practical Use (Especially in NinjaTrader / Futures Context)
Signals: Buy when price closes above the UT Bot line (bullish flip). Sell when it closes below (bearish flip).
Good for trend-following scalps or swings on ES/NQ/MES etc.
Many traders use it for quick entries during evaluations because it gives clear, mechanical levels.
It's widely praised for simplicity and adaptability to volatility but can produce whipsaws in choppy markets (hence the popularity of filters like Heikin Ashi and EMA).
-
Chandelier Exit (often just called "Chandelier") is a classic ATR-based trailing stop indicator, developed by Chuck LeBeau. It is one of the foundational volatility-adjusted trailing stop tools and is frequently compared to (or used similarly to) modern variants like the UT Bot.How
Chandelier Exit Works
It places a trailing stop a certain distance (typically a multiple of ATR) below the highest high (for long positions) or above the lowest low (for shorts).
The stop trails upward as new highs are made (locking in profits) but does not move down until a new high is achieved.
When price closes below the Chandelier line (longs), it signals an exit or potential trend reversal.
It is primarily used as a dynamic stop-loss / exit tool to let winners run while protecting gains in trending markets. It adapts to volatility via ATR — wider stops in volatile conditions, tighter in calm ones.
-
Key Differences in Practice:
Chandelier is more "mechanical" and conservative for exits. It excels at trailing stops in strong trends by anchoring to the highest high/low. It’s great for longer swings or when you want a clear, rule-based profit protector.
UT Bot is more modern and signal-focused. It turns the ATR trailing stop into a full buy/sell system (price crossing the line flips the signal). Many traders love it for its visual clarity and customizability. It’s popular for intraday/scalping and works well alongside other tools.
In ATR trailing stop scenarios (like protecting profits or managing risk in volatile futures markets):
Use Chandelier if you want a straightforward, battle-tested trailing stop anchored to extremes (ideal for trend-following exits).
Use UT Bot if you want integrated signals + trailing (great for mechanical entries/exits, especially in prop firm evaluations where clear rules help with discipline).
Many traders combine elements: Use UT Bot (or similar) for entries and Chandelier-style logic (or a plain ATR trail) for exits.
Downloadable user guide with purchase
After purchase you’ll also get a full PDF user guide.
The guide covers the main concept of ATR and volatility context. It also covers mode comparison, explaining what each does and best uses.
The indicator settings are also covered in detail with example setups.
Note: Please read the guide and test the tool thoroughly in NinjaTrader simulation mode before using it with a live account.