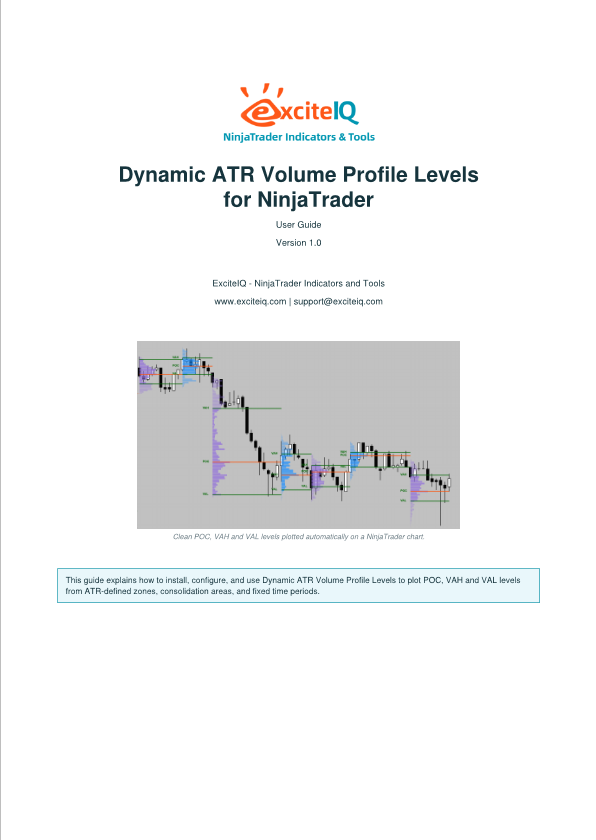
Automatic Dynamic ATR Volume Profile Levels
A Smarter Way to Use Volume Profile Levels
Many traders understand the value of volume profile. The problem is that drawing profiles manually can be slow.
You need to decide where the profile should start, where it should end, whether to profile a trend leg, a pullback, a consolidation, a breakout, or a fixed time period.
That process can take time, and in fast-moving markets it is easy to miss useful areas.
The Dynamic ATR Volume Profile Levels indicator helps solve that problem by automatically plotting profile levels from selected market zones.
It can profile:
ATR-defined price movement zones
Consolidation and balance areas
Fixed time periods such as hourly, daily, or custom minute profiles
Recent market phases where price has moved, paused, rotated, or consolidated
The result is a cleaner chart with automatically generated POC, VAH and VAL levels that traders can use as potential decision areas.
The indicator is a visual decision-support tool designed to help traders see important volume-based levels more quickly.
Save Time Drawing Volume Profile Levels
If you already use volume profile concepts, this indicator gives you a faster way to bring POC, VAH and VAL levels onto your NinjaTrader chart.
Use dynamic ATR-based profile zones.
Use consolidation profile zones.
Use fixed time period profiles.
Show the full profile, or keep only the levels.
Get better market context and quickly see potential levels of interest with cleaner profile levels

What the Dynamic ATR Volume Profile Levels Indicator shows you
The indicator plots three key levels from each selected volume profile zone.
POC — Point of Control
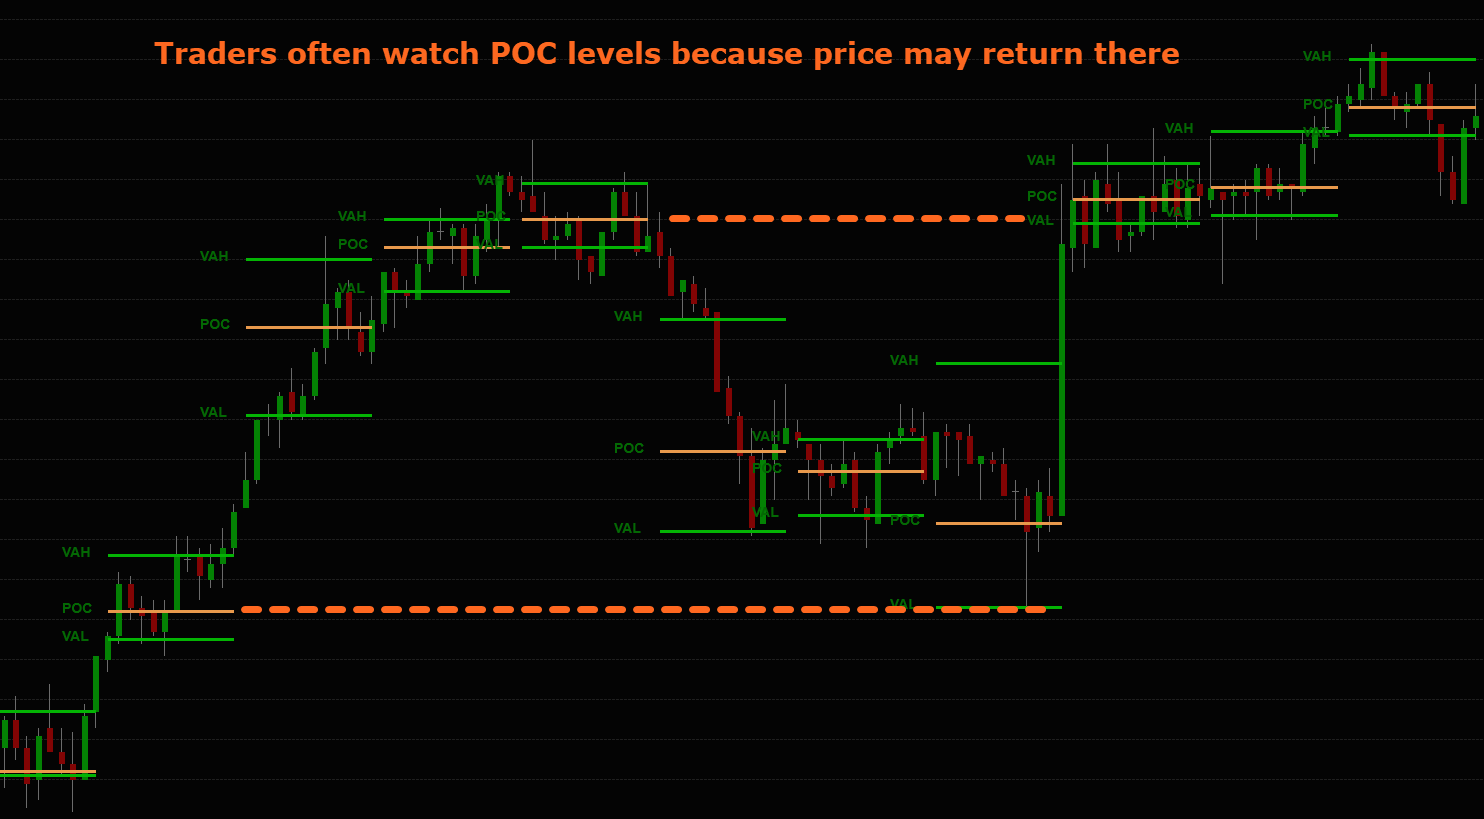
The POC is the price level where the most volume traded inside the profile area. Traders often watch POC levels because price may return to them, pause around them, rotate through them, or reject from them.
A POC is not automatically support or resistance. It is better thought of as a high-interest price area where market participants previously did a lot of business.
The indicator helps highlight these areas automatically.
VAH — Value Area High
VAH marks the upper boundary of the value area.
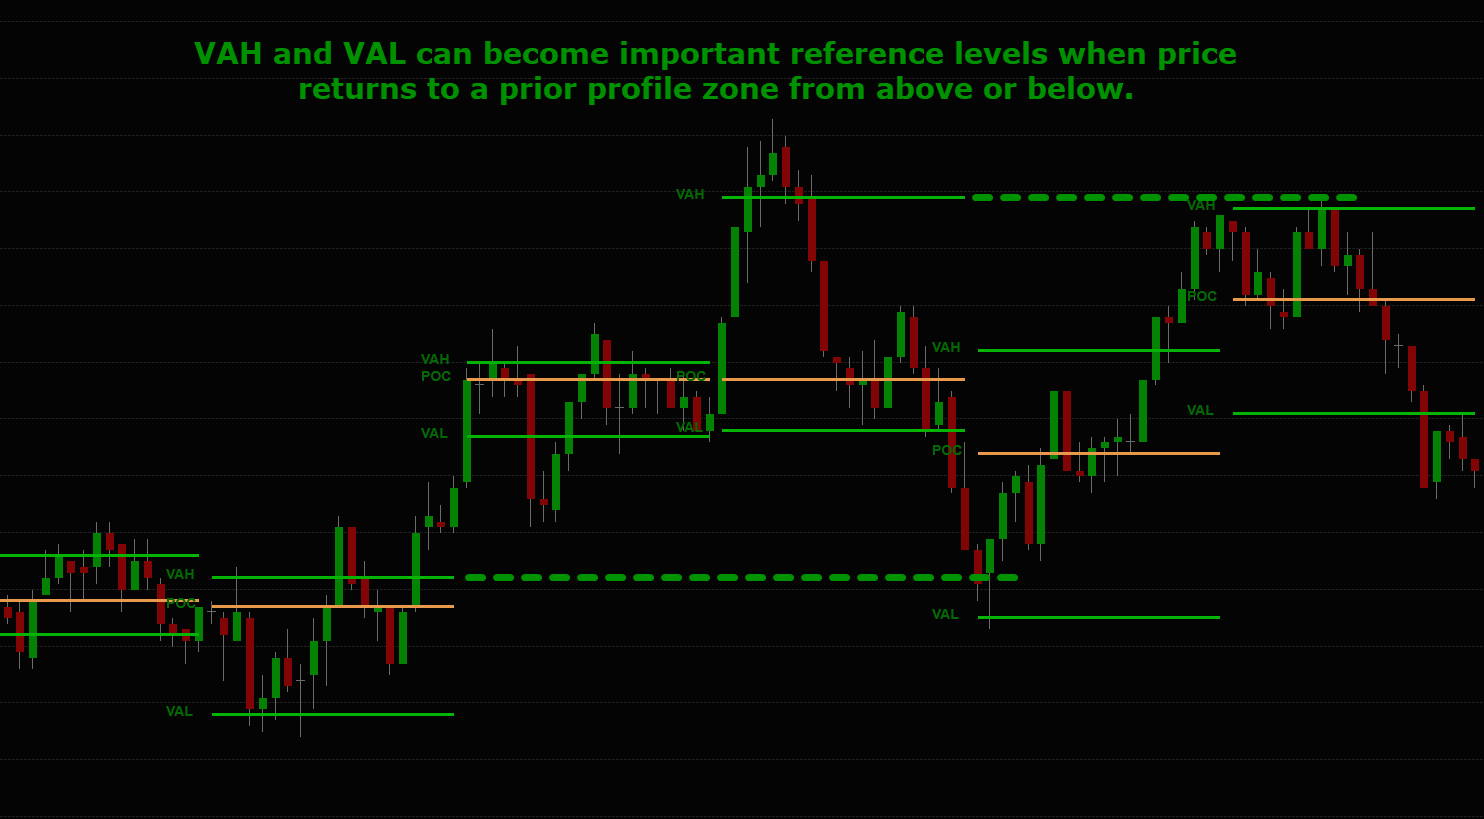
This can become an important reference level when price returns to a prior profile zone from above or below.
Traders may watch VAH for possible continuation, breakout retest, rejection, or acceptance.
VAL — Value Area Low
VAL marks the lower boundary of the value area.
Like VAH, it can become a useful reaction level when price revisits a previous profile area.
VAL can be especially useful when judging whether price is holding above value, accepting back inside value, or rejecting from below.
Dynamic ATR-Based Profile Zones
The main mode of the indicator uses ATR-based market structure to define where volume profile zones should be created.
The tool can use ATR segmentation styles such as:
SuperTrend
Classic ATR Trail
Chandelier
UT Bot Style
SuperTrend remains the recommended default because it often produces cleaner and more stable profile zones.
UT Bot Style is available as an optional mode for traders who already use UT Bot-style logic in their own trading. This allows them to tie volume profile zones to a similar ATR sensitivity framework.
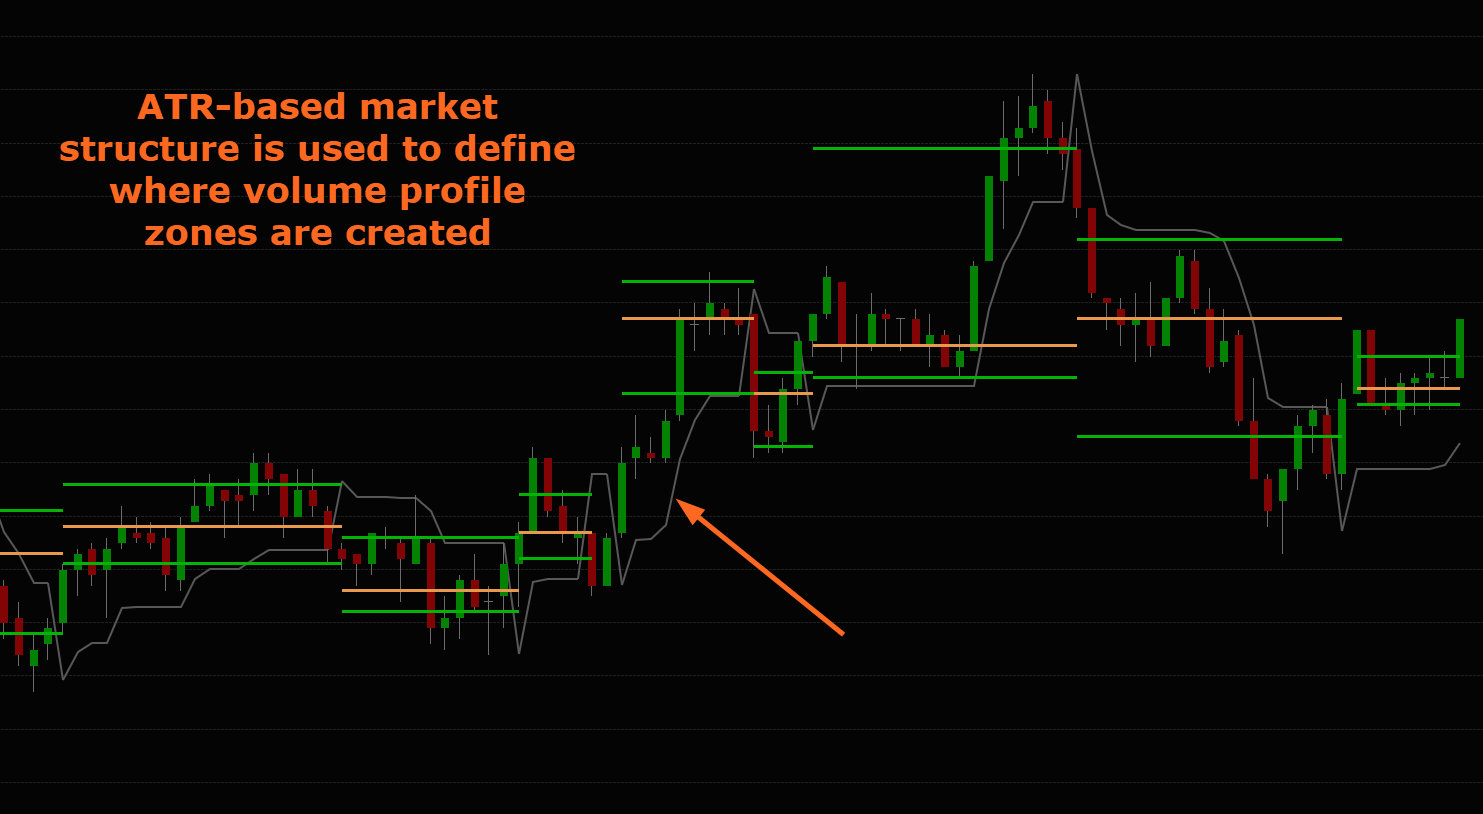
ATR segmentation helps divide the chart into meaningful price phases so that volume profiles can be calculated automatically. This can save time and reduce the need to manually draw profiles over every section of price action.
Consolidation and Balance Zone Detection
Markets do not always trend cleanly. Price often pauses, compresses, rotates, or builds sideways balance before moving again. These consolidation areas can be important because price often returns to test them later.
The indicator includes optional zone detection that can identify sideways or balanced areas and create separate profile levels from those zones. This helps traders see where value was previously built and where price may react if it returns.
The Zone Detail setting gives control over how selective the tool should be:
Major — fewer, broader profile zones
Balanced — default setting for general use
Detailed — more local zones and greater chart detail
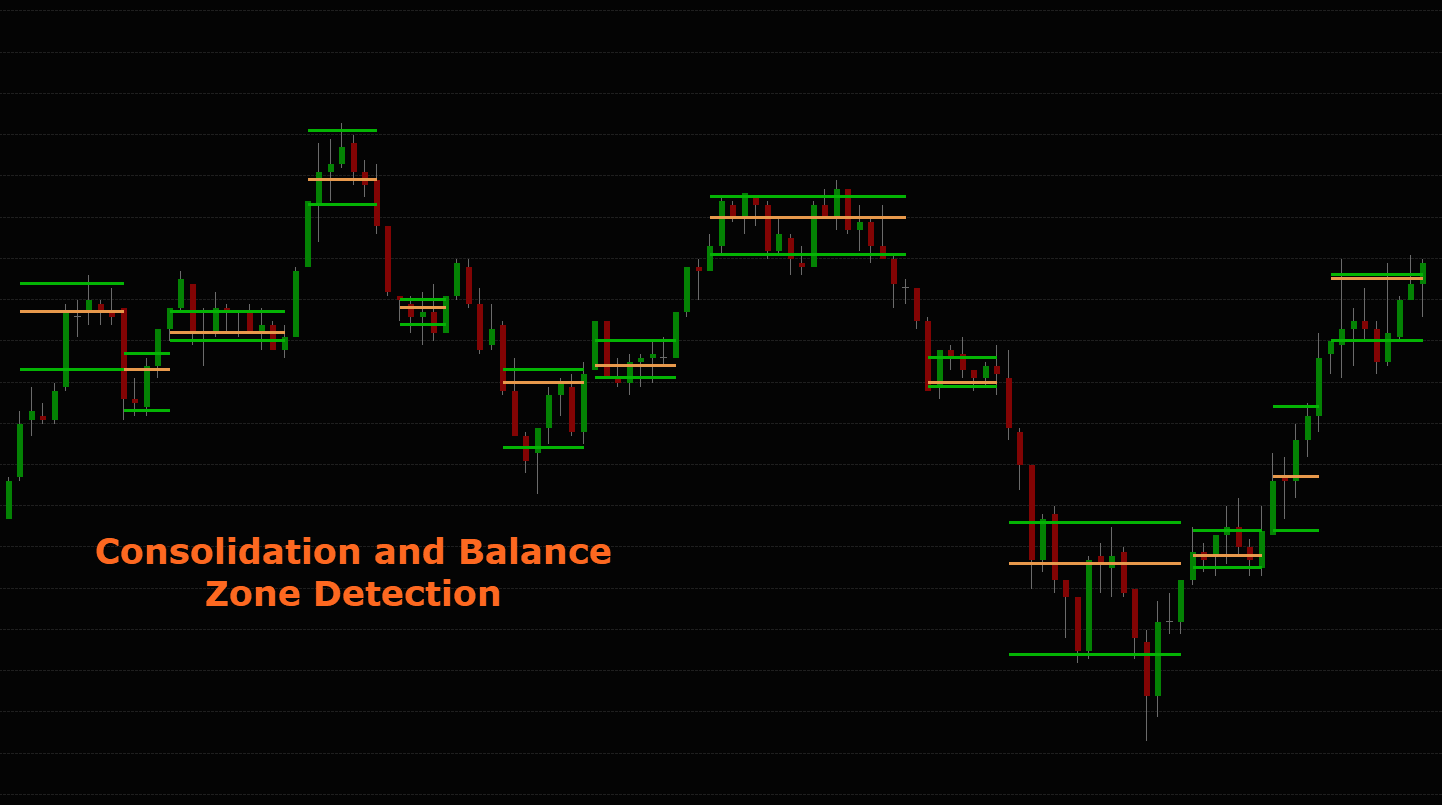
The Dynamic ATR Volume Profile Levels tool integrates automatic consolidation zone detection alongside the use of ATR to define zones of interest. This is a powerful combination helping to assist the detection of potential important levels of interest.
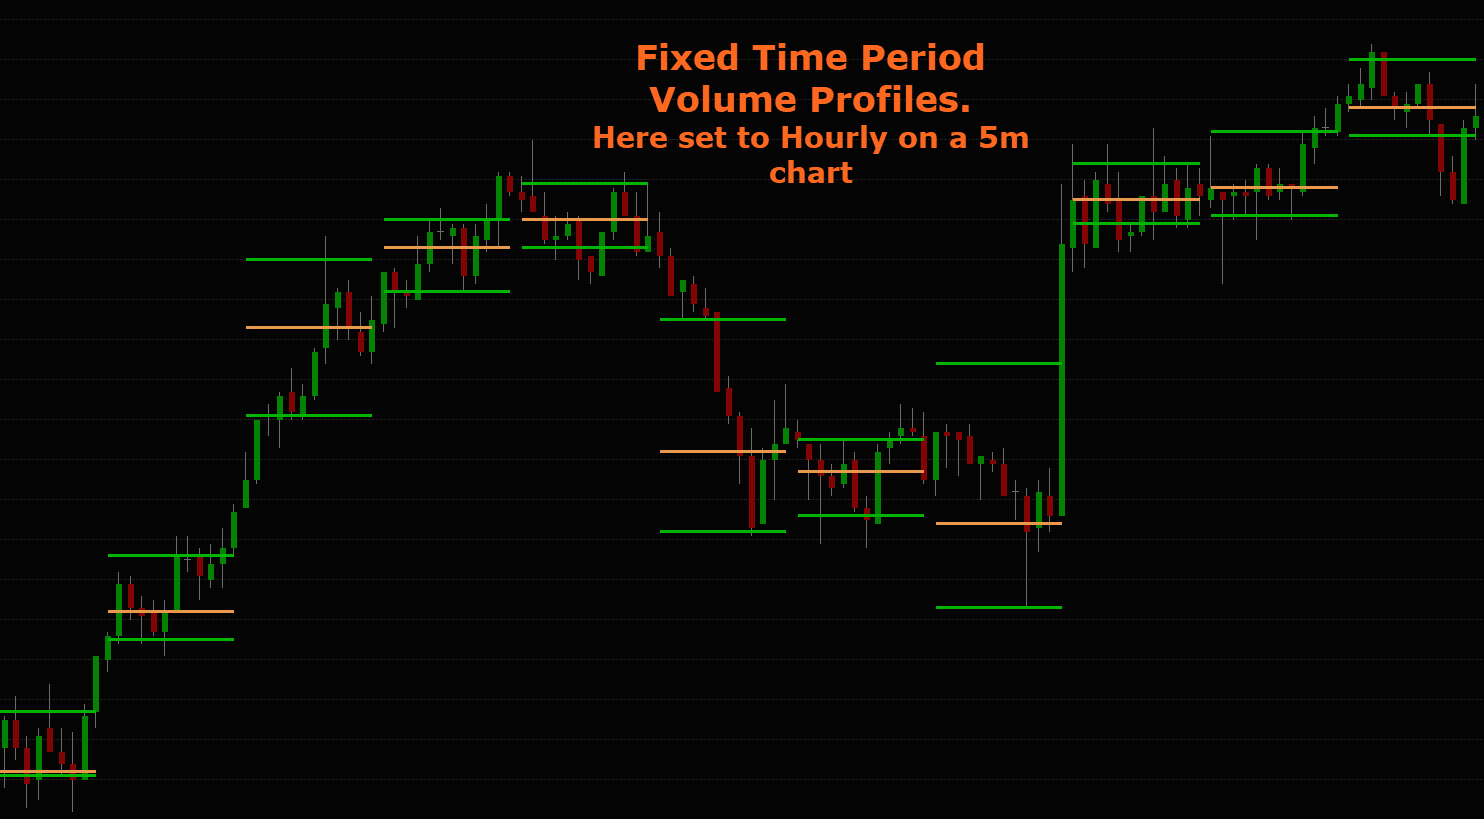
Fixed Time Period Volume Profiles
The indicator can also create profiles over fixed time periods.
This is useful for traders who want automatic profile levels based on standard time blocks rather than dynamic ATR zones.
Fixed period options include:
Daily session profiles
Hourly profiles
Custom minute profiles
For example, a trader may want to automatically plot a profile every 30 minutes, every 60 minutes, every 240 minutes, or once per trading session.
This gives traders another way to view market structure and value areas without manually drawing profiles.
Optional Volume Profile Display
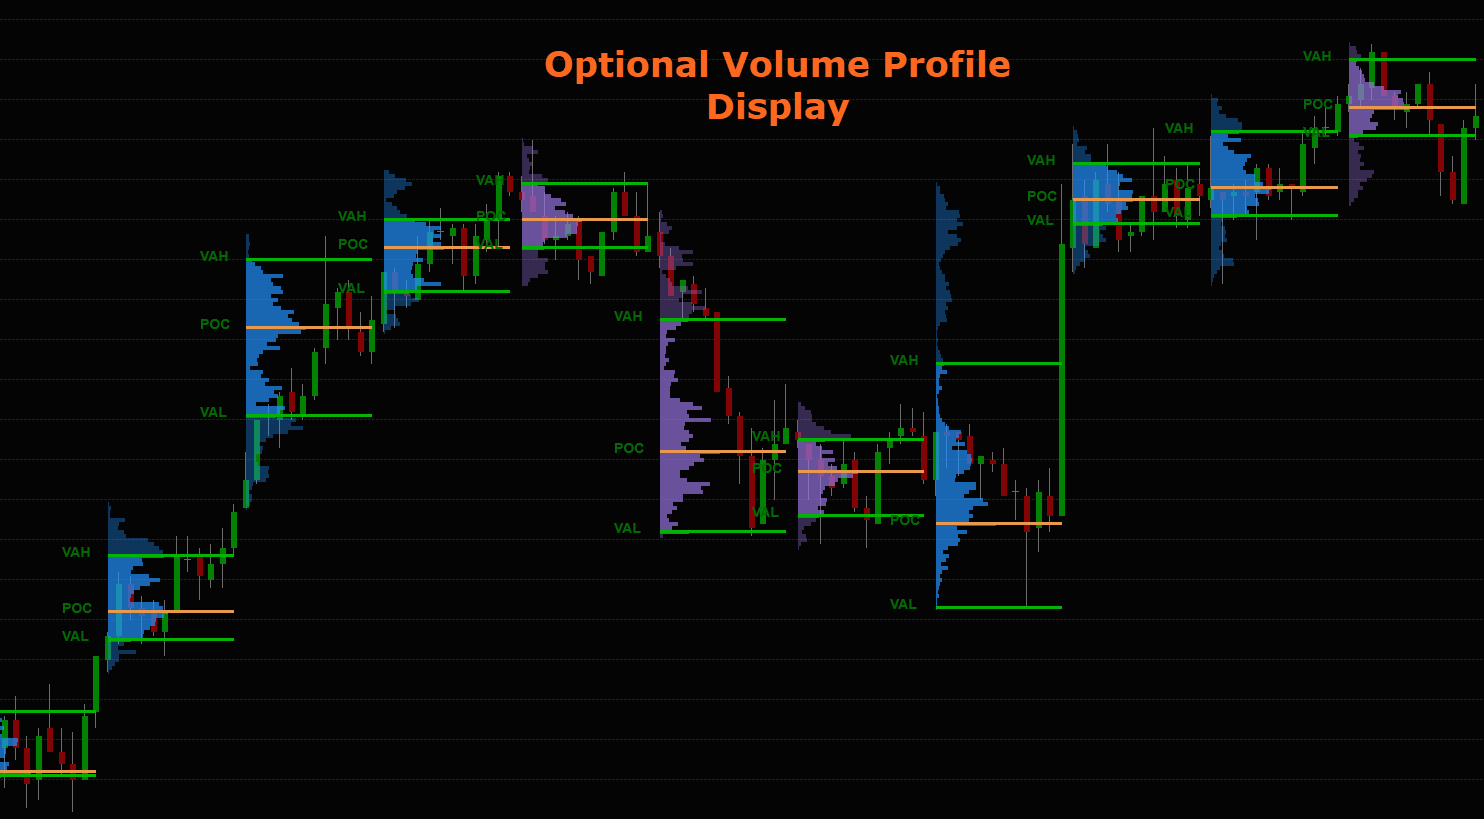
The indicator can show only the levels, or it can also display the horizontal volume profile histogram.
Some traders prefer a clean chart with only POC, VAH and VAL lines. Other traders prefer to see the full profile shape.
The choice is yours.
The profile display includes separate opacity controls for:
Profile opacity
Value area opacity
This allows the value area between VAH and VAL to stand out visually from the rest of the profile.
You can keep the profiles subtle, bold, or turn them off completely and use only the levels.
Example Ways to Use the Indicator
1. Watch for Reactions at VAH and VAL
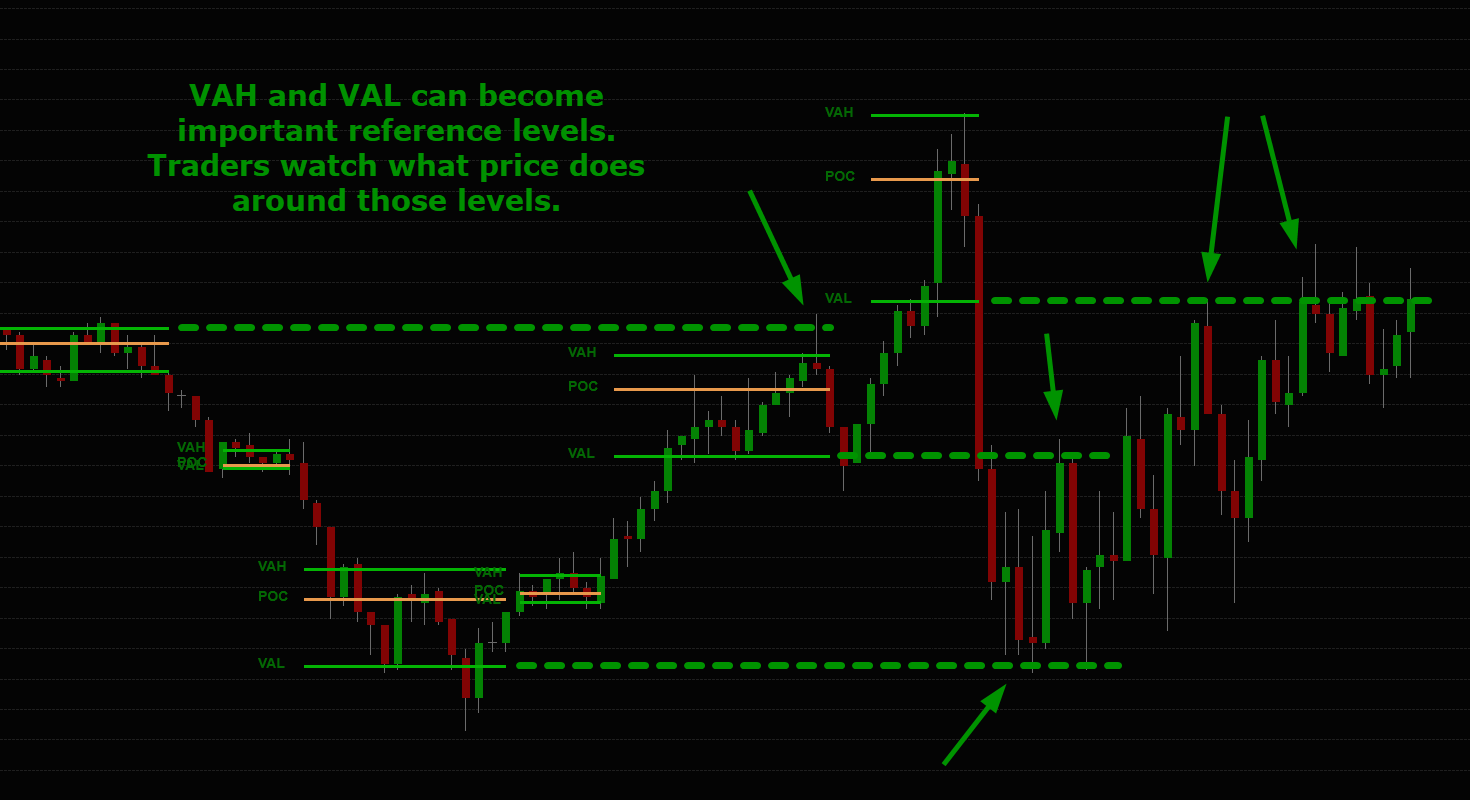
VAH and VAL can act as useful reference areas when price returns to a previous profile zone.
For example, if price breaks above a prior value area and later pulls back to VAH, traders may watch to see whether price holds, rejects, or accepts back inside value.
If price approaches VAL from below, traders may watch for rejection or continuation depending on broader market context.
These levels are not automatic buy or sell signals, but they can help identify areas where price may respond.
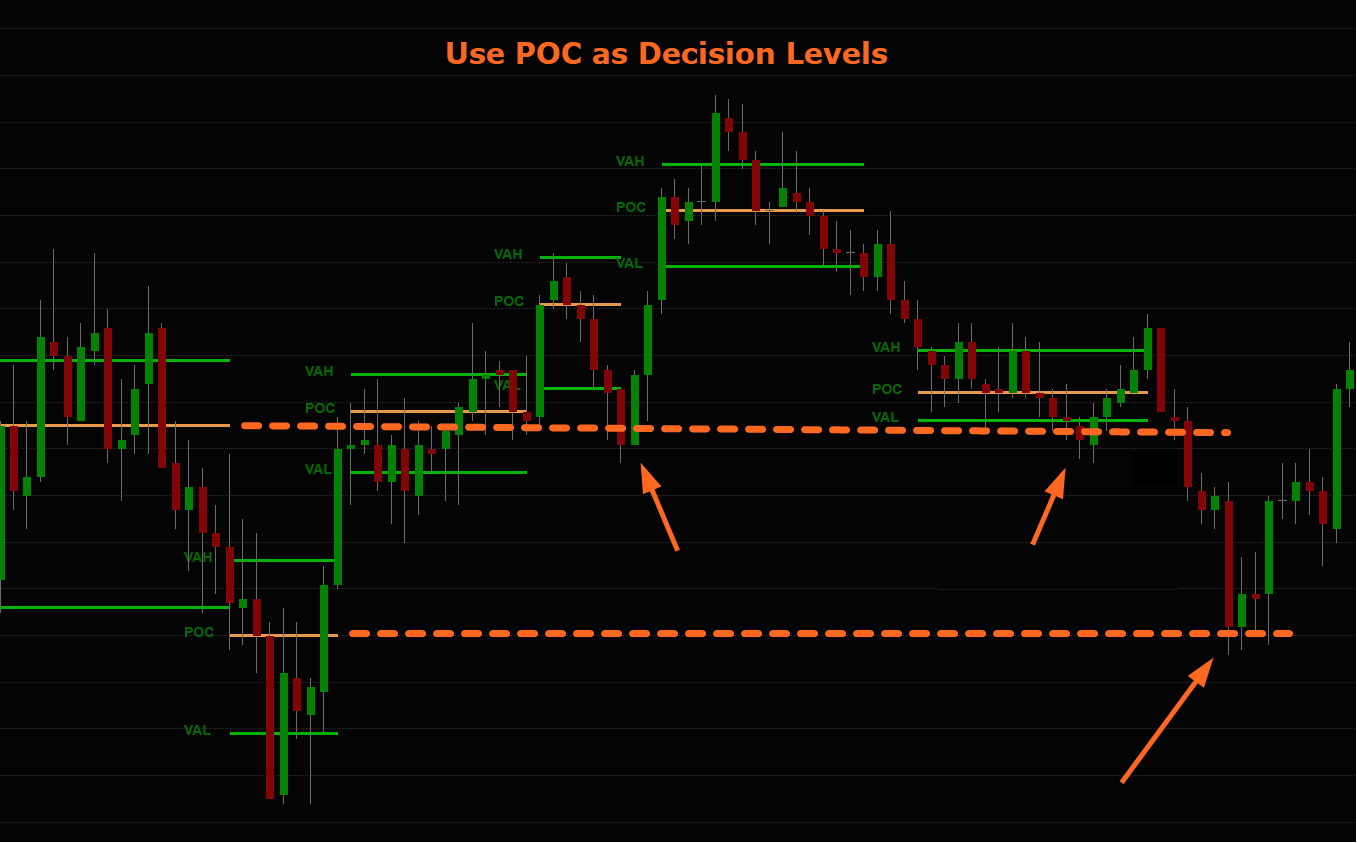
2. Use POC as a Decision Level
The POC shows where the most volume traded inside the selected profile area.
Price may return to a prior POC because it represents a previous area of high participation.
A trader might use POC as a decision point:
Does price pause around the POC?
Does price reject from the POC?
Does price accept and rotate around it?
Does price move straight through it with strength?
The indicator helps highlight these areas automatically.
3. Breakout and Retest
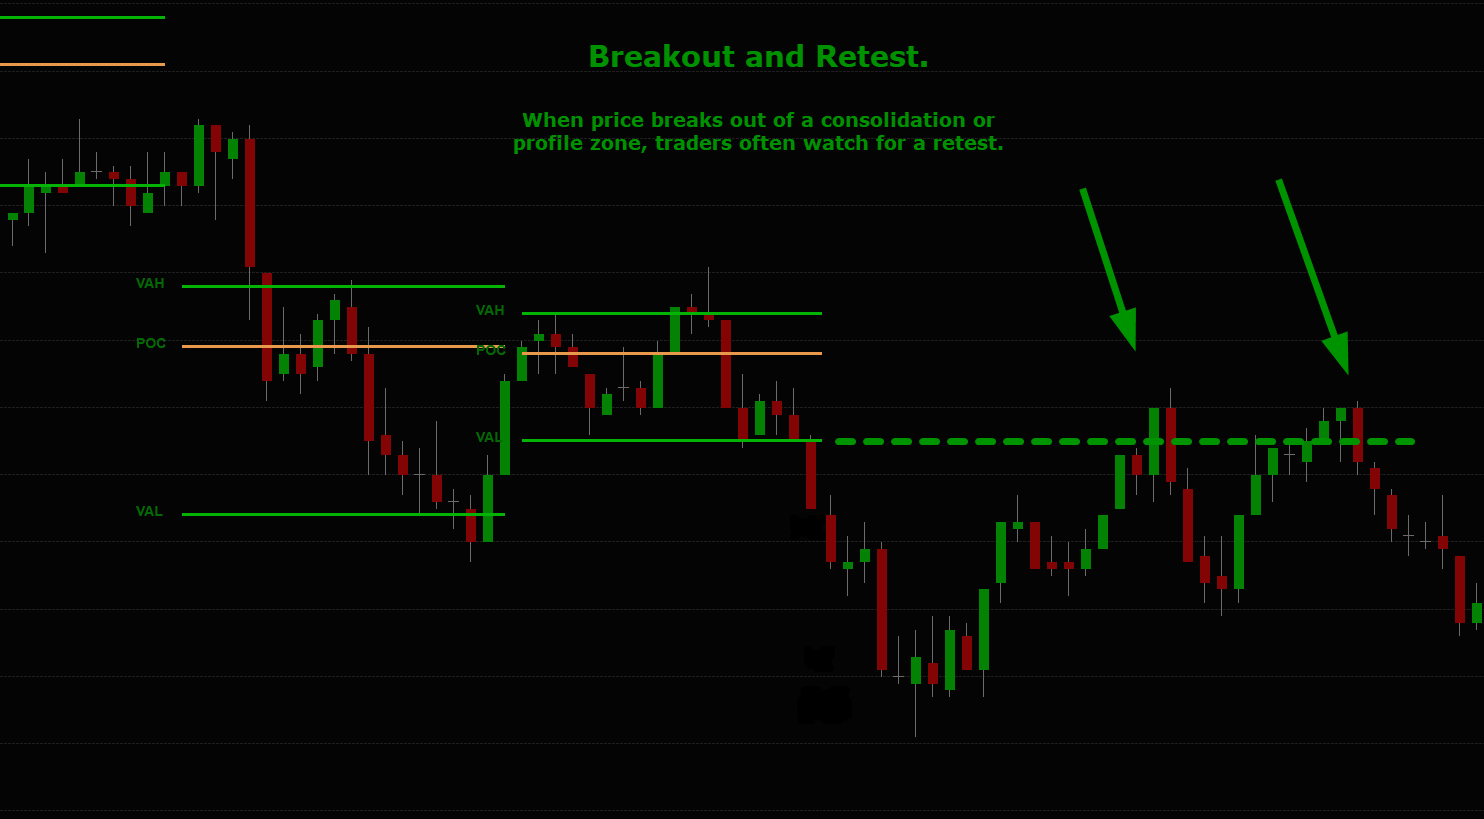
When price breaks out of a consolidation or profile zone, traders often watch for a retest.
A common idea is:
Price breaks above a profile zone
Price later pulls back toward VAH or POC
Trader watches for signs of support, rejection, or continuation
The same concept can be reversed for downside moves. This can help traders plan trades around defined areas instead of reacting randomly to price movement.
4. Avoid Poor Trade Locations
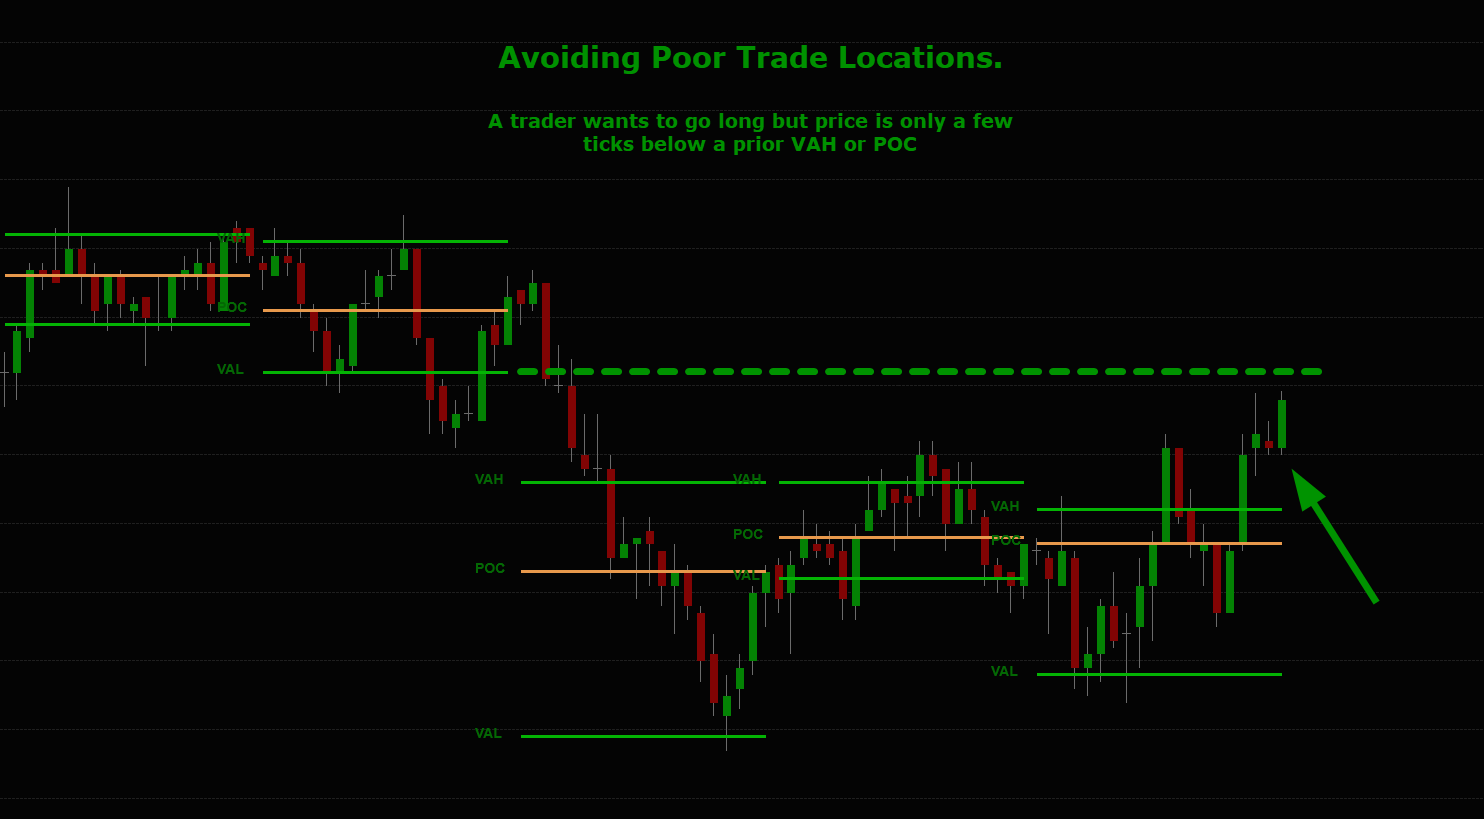
The indicator can also help traders avoid entering trades directly into nearby opposing levels.
For example, if a trader wants to go long but price is only a few ticks below a prior VAH or POC, that may be a poor location because price could react there.
This makes the tool useful not only for finding potential trade areas, but also for filtering out weaker trade locations.
5. Combine With Trend and Price Action
The indicator is not designed to be used in isolation. It works best when combined with:
Market context
Price action
Trend direction
Support and resistance
Order flow
Higher timeframe structure
Personal trading rules
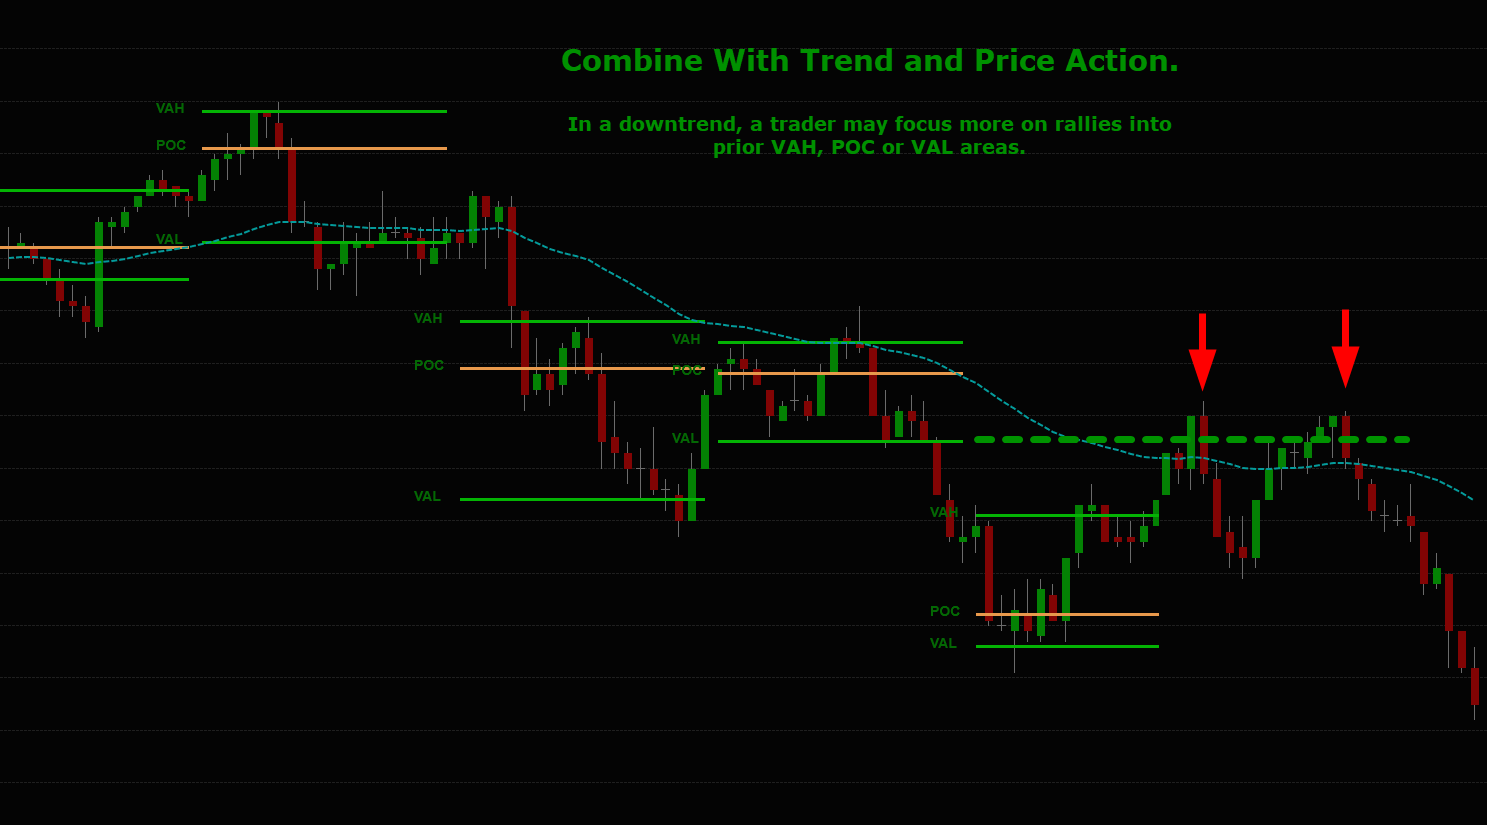
For example, in a downtrend, a trader may focus more on rallies into prior VAH, POC or VAL areas. In an uptrend, a trader may focus more on pullbacks into prior value areas as possible reaction zones. The indicator gives the levels. The trader still makes the trading decision.
Designed for Discretionary Traders
Dynamic ATR Volume Profile Levels is designed for NinjaTrader users who want a faster way to see volume profile structure on their charts.
It may be useful for:
Futures traders
Index traders
Intraday traders
Scalpers
Swing traders
Traders using ES, MES, NQ, MNQ and other futures markets
Traders who already use volume profile concepts
Traders who manually draw profile zones and want to save time
Traders who want cleaner POC, VAH and VAL reference levels
The tool is especially useful for traders who like volume profile but do not want to manually draw and adjust profiles all day.
Fully Customisable
Every trader has different chart preferences. The indicator includes a range of settings so you can control how much information appears on the chart.
Customisation options include:
Profile generation mode
ATR segmentation mode
Zone detail
Fixed time period profiles
Profile ticks per level
Value area percentage
POC on/off
VAH / VAL on/off
Volume profile histogram on/off
Profile opacity
Value area opacity
Level lifecycle
Label display
Label position
Line width
Profile colours
POC colour
VAH / VAL colour
Maximum profiles shown
Tick accurate or bar approximation mode
You can create a clean level-only chart, or display full profile histograms with value area highlighting.
Save Time Drawing Volume Profile Levels
If you already use volume profile concepts, this indicator gives you a faster way to bring POC, VAH and VAL levels onto your NinjaTrader chart.
Use dynamic ATR-based profile zones.
Use consolidation profile zones.
Use fixed time period profiles.
Show the full profile, or keep only the levels.
The goal is simple: Less manual drawing. Cleaner profile levels. Faster, clearer and better market context.
Downloadable user guide with purchase
After purchase you’ll also get a full PDF user guide.
The guide explains the indicator settings, explanation of each mode and main settings, and example use cases.