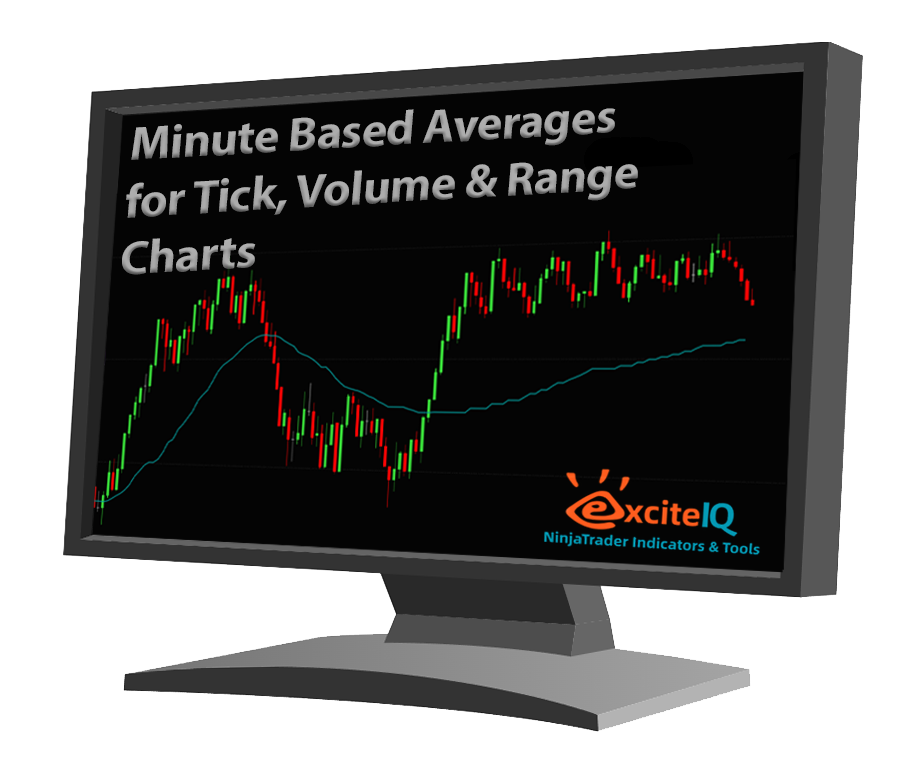
This indicator lets you plot a true minute-based EMA or SMA directly onto Tick, Volume, and Range bar charts.
For example, you can display:
A 20 EMA calculated from a 5 minute chart, plotted onto a 1000 tick chart
A 50 SMA calculated from a 15 minute chart, plotted onto a range chart
A 200 EMA calculated from a 60 minute chart, plotted onto a volume chart
This gives you the benefit of your preferred execution chart while still keeping important higher-timeframe moving average levels visible.
This indicator lets you plot a true minute-based EMA or SMA directly onto Tick, Volume, and Range bar charts.
For example, you can display:
A 20 EMA calculated from a 5 minute chart, plotted onto a 1000 tick chart
A 50 SMA calculated from a 15 minute chart, plotted onto a range chart
A 200 EMA calculated from a 60 minute chart, plotted onto a volume chart
This gives you the benefit of your preferred execution chart while still keeping important higher-timeframe moving average levels visible.
This indicator lets you plot a true minute-based EMA or SMA directly onto Tick, Volume, and Range bar charts.
For example, you can display:
A 20 EMA calculated from a 5 minute chart, plotted onto a 1000 tick chart
A 50 SMA calculated from a 15 minute chart, plotted onto a range chart
A 200 EMA calculated from a 60 minute chart, plotted onto a volume chart
This gives you the benefit of your preferred execution chart while still keeping important higher-timeframe moving average levels visible.
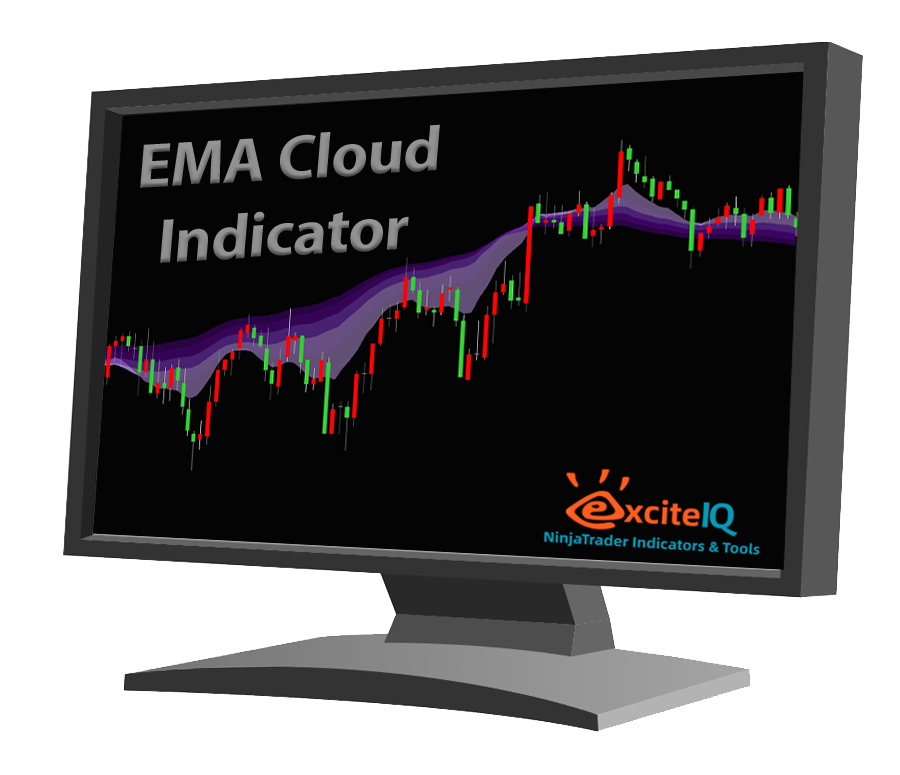
This indicator was created for traders who like the clean visual style of EMA clouds.
It gives you a flexible, attractive and easy-to-read EMA cloud layout that can make your charts clearer and more visually useful.
For traders who like colour-coded moving average structure, this is a simple but effective addition to your trading toolkit.
This indicator was created for traders who like the clean visual style of EMA clouds.
It gives you a flexible, attractive and easy-to-read EMA cloud layout that can make your charts clearer and more visually useful.
For traders who like colour-coded moving average structure, this is a simple but effective addition to your trading toolkit.
This indicator was created for traders who like the clean visual style of EMA clouds.
It gives you a flexible, attractive and easy-to-read EMA cloud layout that can make your charts clearer and more visually useful.
For traders who like colour-coded moving average structure, this is a simple but effective addition to your trading toolkit.
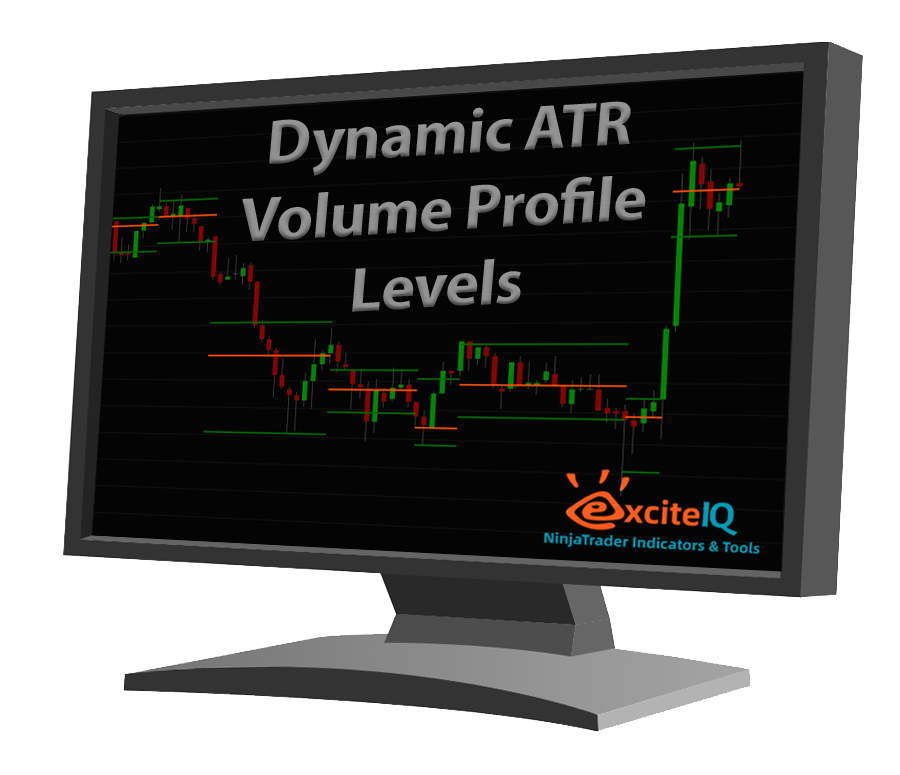
The Dynamic ATR Volume Profile Levels indicator is a tool designed to automatically identify important price areas and plot volume profile levels directly on your chart.
Instead of manually drawing volume profiles over every move, pullback, consolidation, or fixed time period, this indicator can automatically calculate and display key profile levels, including:
POC — Point of Control
VAH — Value Area High
VAL — Value Area Low
These levels can help traders identify potential reaction areas, support and resistance zones, breakout retest areas, and locations where price may pause, rotate, reject, or continue.
The Dynamic ATR Volume Profile Levels indicator is a tool designed to automatically identify important price areas and plot volume profile levels directly on your chart.
Instead of manually drawing volume profiles over every move, pullback, consolidation, or fixed time period, this indicator can automatically calculate and display key profile levels, including:
POC — Point of Control
VAH — Value Area High
VAL — Value Area Low
These levels can help traders identify potential reaction areas, support and resistance zones, breakout retest areas, and locations where price may pause, rotate, reject, or continue.
The Dynamic ATR Volume Profile Levels indicator is a tool designed to automatically identify important price areas and plot volume profile levels directly on your chart.
Instead of manually drawing volume profiles over every move, pullback, consolidation, or fixed time period, this indicator can automatically calculate and display key profile levels, including:
POC — Point of Control
VAH — Value Area High
VAL — Value Area Low
These levels can help traders identify potential reaction areas, support and resistance zones, breakout retest areas, and locations where price may pause, rotate, reject, or continue.

The Auto Position Size - Risk Reward Trade Tool.
Enables you to quickly draw your trade directly on the chart, set your entry and stop-loss levels visually, and instantly see the correct position size based on your chosen fixed dollar risk or percentage of account risk.
The tool also includes trading using optional partial exits and breakeven stop movement.
No calculator. No spreadsheet. No guessing.
The Auto Position Size - Risk Reward Trade Tool.
Enables you to quickly draw your trade directly on the chart, set your entry and stop-loss levels visually, and instantly see the correct position size based on your chosen fixed dollar risk or percentage of account risk.
The tool also includes trading using optional partial exits and breakeven stop movement.
No calculator. No spreadsheet. No guessing.
The Auto Position Size - Risk Reward Trade Tool.
Enables you to quickly draw your trade directly on the chart, set your entry and stop-loss levels visually, and instantly see the correct position size based on your chosen fixed dollar risk or percentage of account risk.
The tool also includes trading using optional partial exits and breakeven stop movement.
No calculator. No spreadsheet. No guessing.
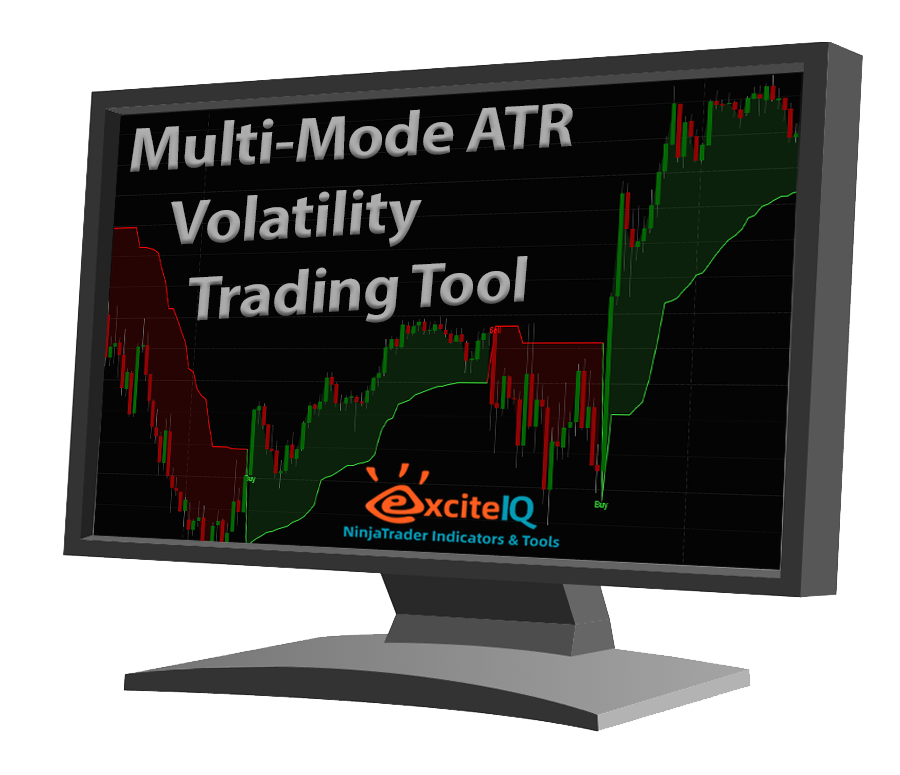
The ATR Volatility Trading Tool for NinjaTrader is designed to give traders a clearer visual framework for understanding price action, trend state, and volatility-based trading opportunities — directly on the chart.
Unlike a simple single-purpose ATR indicator, this tool includes multiple ATR-based modes in one package.
You can use Classic ATR Trail for a simple volatility-following line.
SuperTrend mode for a clean trend direction view.
Chandelier mode for a more structured trend-following framework.
UT Bot Style mode for clear Buy and Sell style signals.
And ATR Bands mode to show volatility envelopes around price.
This gives traders flexibility to choose the view that best suits their market, timeframe, and trading style.
The ATR Volatility Trading Tool for NinjaTrader is designed to give traders a clearer visual framework for understanding price action, trend state, and volatility-based trading opportunities — directly on the chart.
Unlike a simple single-purpose ATR indicator, this tool includes multiple ATR-based modes in one package.
You can use Classic ATR Trail for a simple volatility-following line.
SuperTrend mode for a clean trend direction view.
Chandelier mode for a more structured trend-following framework.
UT Bot Style mode for clear Buy and Sell style signals.
And ATR Bands mode to show volatility envelopes around price.
This gives traders flexibility to choose the view that best suits their market, timeframe, and trading style.
The ATR Volatility Trading Tool for NinjaTrader is designed to give traders a clearer visual framework for understanding price action, trend state, and volatility-based trading opportunities — directly on the chart.
Unlike a simple single-purpose ATR indicator, this tool includes multiple ATR-based modes in one package.
You can use Classic ATR Trail for a simple volatility-following line.
SuperTrend mode for a clean trend direction view.
Chandelier mode for a more structured trend-following framework.
UT Bot Style mode for clear Buy and Sell style signals.
And ATR Bands mode to show volatility envelopes around price.
This gives traders flexibility to choose the view that best suits their market, timeframe, and trading style.
The Dynamic ATR Volume Profile Levels indicator is a tool designed to automatically identify important price areas and plot volume profile levels directly on your chart.
Instead of manually drawing volume profiles over every move, pullback, consolidation, or fixed time period, this indicator can automatically calculate and display key profile levels, including:
POC — Point of Control
VAH — Value Area High
VAL — Value Area Low
These levels can help traders identify potential reaction areas, support and resistance zones, breakout retest areas, and locations where price may pause, rotate, reject, or continue.
This indicator lets you plot a true minute-based EMA or SMA directly onto Tick, Volume, and Range bar charts.
For example, you can display:
A 20 EMA calculated from a 5 minute chart, plotted onto a 1000 tick chart
A 50 SMA calculated from a 15 minute chart, plotted onto a range chart
A 200 EMA calculated from a 60 minute chart, plotted onto a volume chart
This gives you the benefit of your preferred execution chart while still keeping important higher-timeframe moving average levels visible.
This indicator was created for traders who like the clean visual style of EMA clouds.
It gives you a flexible, attractive and easy-to-read EMA cloud layout that can make your charts clearer and more visually useful.
For traders who like colour-coded moving average structure, this is a simple but effective addition to your trading toolkit.
The ATR Volatility Trading Tool for NinjaTrader is designed to give traders a clearer visual framework for understanding price action, trend state, and volatility-based trading opportunities — directly on the chart.
Unlike a simple single-purpose ATR indicator, this tool includes multiple ATR-based modes in one package.
You can use Classic ATR Trail for a simple volatility-following line.
SuperTrend mode for a clean trend direction view.
Chandelier mode for a more structured trend-following framework.
UT Bot Style mode for clear Buy and Sell style signals.
And ATR Bands mode to show volatility envelopes around price.
This gives traders flexibility to choose the view that best suits their market, timeframe, and trading style.
The Auto Position Size - Risk Reward Trade Tool.
Enables you to quickly draw your trade directly on the chart, set your entry and stop-loss levels visually, and instantly see the correct position size based on your chosen fixed dollar risk or percentage of account risk.
The tool also includes trading using optional partial exits and breakeven stop movement.
No calculator. No spreadsheet. No guessing.
No results match your search. Try removing a few filters.
