
 Image 1 of 1
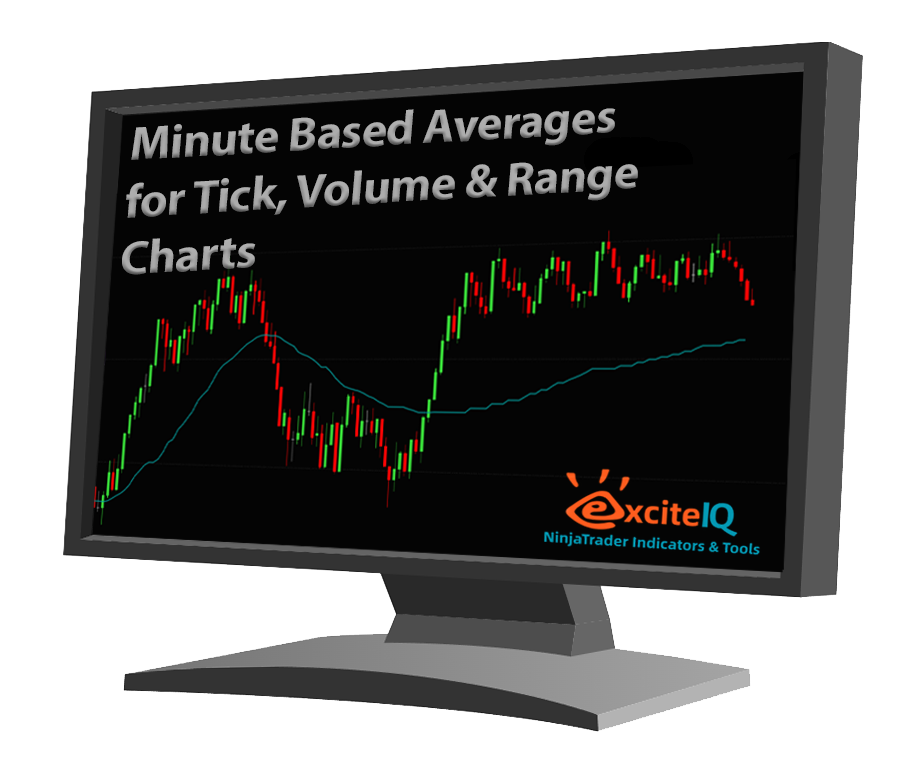
This indicator lets you plot a true minute-based EMA or SMA directly onto Tick, Volume, and Range bar charts.
For example, you can display:
A 20 EMA calculated from a 5 minute chart, plotted onto a 1000 tick chart
A 50 SMA calculated from a 15 minute chart, plotted onto a range chart
A 200 EMA calculated from a 60 minute chart, plotted onto a volume chart
This gives you the benefit of your preferred execution chart while still keeping important higher-timeframe moving average levels visible.
This indicator lets you plot a true minute-based EMA or SMA directly onto Tick, Volume, and Range bar charts.
For example, you can display:
A 20 EMA calculated from a 5 minute chart, plotted onto a 1000 tick chart
A 50 SMA calculated from a 15 minute chart, plotted onto a range chart
A 200 EMA calculated from a 60 minute chart, plotted onto a volume chart
This gives you the benefit of your preferred execution chart while still keeping important higher-timeframe moving average levels visible.